XRP price extended gains above the $0.6220 zone. The price tested the $0.6330 zone before there was a pullback amid declines in BTC and ETH.
XRP price started a downside correction from the $0.6330 zone.
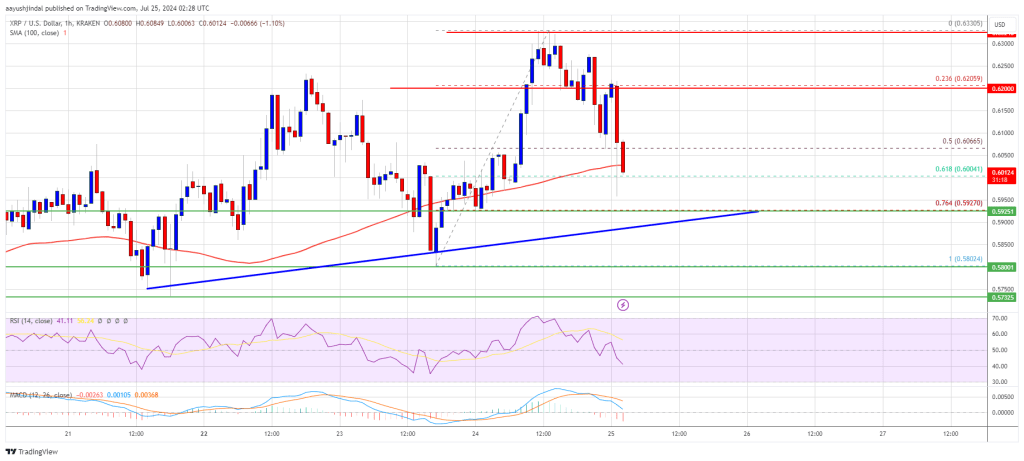
The price is now trading near $0.600 and the 100-hourly Simple Moving Average.
There is a connecting bullish trend line forming with support at $0.5920 on the hourly chart of the XRP/USD pair (data source from Kraken).
The pair could start another increase if it stays above the $0.590 support zone.
XRP price extended its increase above the $0.6150 resistance. It even climbed above the $0.6220 resistance before the bears appeared. A high was formed at $0.6330 before Bitcoin and Ethereum dragged the market lower.
There was a move below the $0.6150 and $0.6120 levels. The price declined below the 50% Fib retracement level of the upward move from the $0.5802 swing low to the $0.6330 high. It is now trading near $0.600 and the 100-hourly Simple Moving Average.
There is also a connecting bullish trend line forming with support at $0.5920 on the hourly chart of the XRP/USD pair. The trend line is close to the 76.4% Fib retracement level of the upward move from the $0.5802 swing low to the $0.6330 high.
If there is a fresh upward move, the price could face resistance near the $0.6120 level. The first major resistance is near the $0.6200 level. The next key resistance could be $0.6220. A clear move above the $0.6220 resistance might send the price toward the $0.6350 resistance. The next major resistance is near the $0.6500 level. Any more gains might send the price toward the $0.680 resistance.
If XRP fails to clear the $0.6120 resistance zone, it could continue to move down. Initial support on the downside is near the $0.5950 level. The next major support is at $0.5920 and the trend line zone.
If there is a downside break and a close below the $0.5920 level, the price might continue to decline toward the $0.580 support in the near term.
Technical Indicators
Hourly MACD – The MACD for XRP/USD is now gaining pace in the bearish zone.
Hourly RSI (Relative Strength Index) – The RSI for XRP/USD is now below the 50 level.
Major Support Levels – $0.5920 and $0.5800.
Major Resistance Levels – $0.6120 and $0.6220.
[#item_full_content]NewsBTCRead MoreStrategy, formerly known as MicroStrategy and led by Michael Saylor, disclosed a new Bitcoin (BTC)…
On-chain data shows the Bitcoin long-term holders have seen their supply go up recently, despite…
A crypto analyst who previously warned traders and investors that the recent Bitcoin (BTC) price…
Bitcoin price started a recovery wave from $68,000. BTC is now back above $70,000 and…
John Haar, managing director at Swan Private, says the policy response to COVID remains one…
Cryptos bounced on Trump’s five-day pause announcement, but the next move hinges on whether tensions…