Bitcoin price started another decline below the $66,500 level. BTC is gaining bearish momentum and might revisit the $63,200 support.
Bitcoin started a fresh decline from the $68,500 resistance zone.
The price is trading below $65,500 and the 100 hourly Simple moving average.
There was a break below a key bullish trend line with support at $66,000 on the hourly chart of the BTC/USD pair (data feed from Kraken).
The pair might extend losses and trade toward the $63,200 support zone.
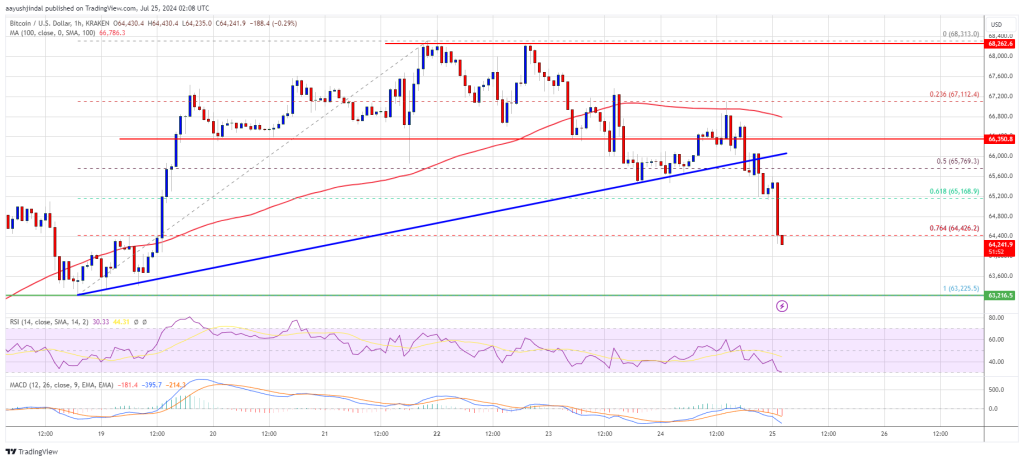
Bitcoin price failed to hold gains above the $66,500 support level. BTC started another decline and traded below the $66,000 support zone. There was a move below the 50% Fib retracement level of the upward move from the $63,225 swing low to the $68,313 high.
Besides, there was a break below a key bullish trend line with support at $66,000 on the hourly chart of the BTC/USD pair. The pair is now accelerating lower below the $65,000 level.
Bitcoin price is now trading below $66,000 and the 100 hourly Simple moving average. It is also below the 76.4% Fib retracement level of the upward move from the $63,225 swing low to the $68,313 high. If there is a recovery wave, the price could face resistance near the $65,200 level.
The first key resistance is near the $65,500 level. A clear move above the $65,500 resistance might spark another increase in the coming sessions. The next key resistance could be $66,200. The next major hurdle sits at $66,800 and the 100 hourly Simple moving average. A close above the $66,800 resistance might push the price further higher. In the stated case, the price could rise and test the $68,000 resistance.
If Bitcoin fails to recover above the $65,500 resistance zone, it could continue to move down. Immediate support on the downside is near the $64,000 level.
The first major support is $63,200. The next support is now near $62,500. Any more losses might send the price toward the $61,500 support zone in the near term.
Technical indicators:
Hourly MACD – The MACD is now gaining pace in the bearish zone.
Hourly RSI (Relative Strength Index) – The RSI for BTC/USD is now below the 50 level.
Major Support Levels – $64,000, followed by $63,200.
Major Resistance Levels – $65,500, and $66,800.
[#item_full_content]NewsBTCRead MoreBitcoin Magazine Strategy (MSTR) Stock Craters 10%, Hits Two-Year Low as Bitcoin Crashes Below $60K,…
Bitcoin Magazine Bitcoin Price Collapses to $59,000 — and the Worst May Not Be Over…
South Korean memory chip giant on Wednesday filed to raise nearly $30 billion in a…
TL;DR BlackRock says a 1% to 2% Bitcoin allocation can be reasonable in a multi-asset…
A 50% drop from recent highs has pushed the asset into a zone historically labeled…
Bitcoin Magazine Bitcoin Price Crashes Toward $61,000 as Bloodbath Engulfs Crypto Stocks Bitcoin price is…