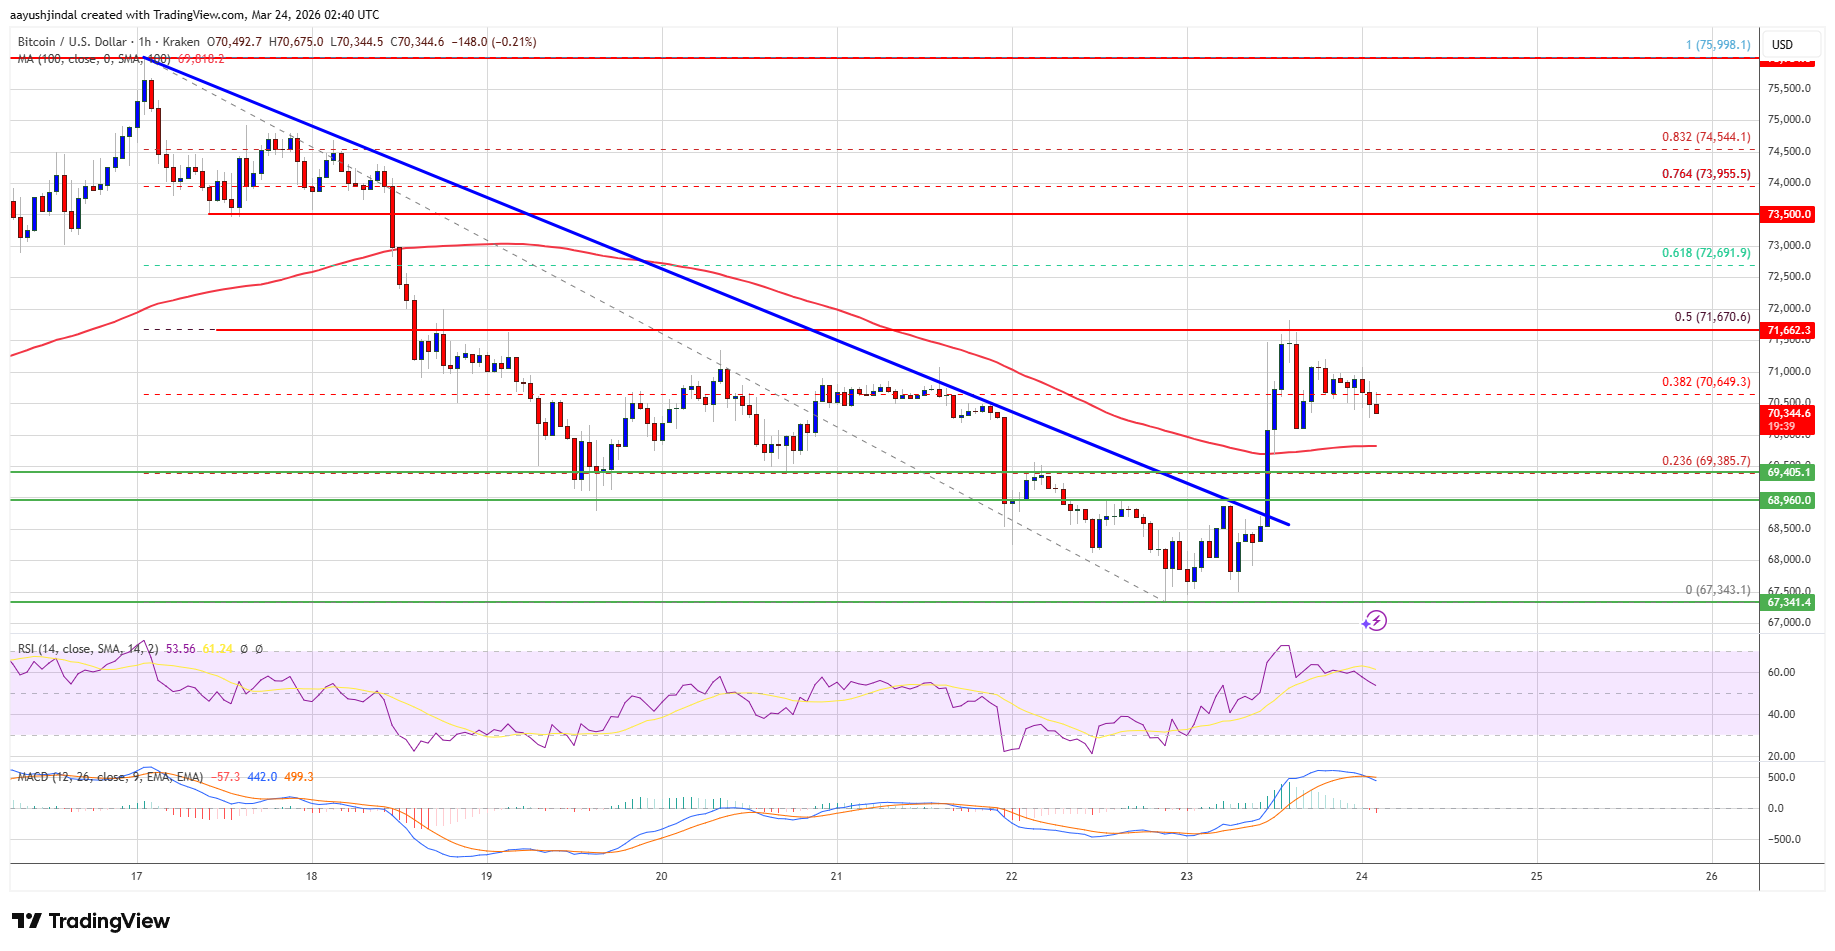
Bitcoin price started a recovery wave from $68,000. BTC is now back above $70,000 and might struggle to continue higher in the near term.
Bitcoin started a decent recovery wave above $69,500 and $70,000.
The price is trading above $70,000 and the 100 hourly simple moving average.
There was a break above a bearish trend line with resistance at $69,500 on the hourly chart of the BTC/USD pair (data feed from Kraken).
The pair might start another decline if it stays below the $71,500 and $72,000 levels.
Bitcoin price found support near the $67,500 zone and recently started a recovery wave. BTC climbed above the $68,800 and $69,500 resistance levels.
There was a break above a bearish trend line with resistance at $69,500 on the hourly chart of the BTC/USD pair. The bulls were able to push the price above the 38.2% Fib retracement level of the downward move from the $75,999 swing high to the $67,343 low.
However, the price faced resistance near the $71,500 zone and the 50% Fib retracement level of the downward move from the $75,999 swing high to the $67,343 low. Bitcoin is now trading above $70,000 and the 100 hourly simple moving average.
If the price remains stable above $70,000, it could attempt a fresh increase. Immediate resistance is near the $71,650 level. The first key resistance is near the $72,000 level. A close above the $72,000 resistance might send the price further higher.
In the stated case, the price could rise and test the $73,500 resistance. Any more gains might send the price toward the $74,200 level. The next barrier for the bulls could be $75,000.
If Bitcoin fails to rise above the $71,650 resistance zone, it could start another decline. Immediate support is near the $70,000 level. The first major support is near the $69,350 level.
The next support is now near the $68,950 zone. Any more losses might send the price toward the $68,000 support in the near term. The main support now sits at $67,500, below which BTC might struggle to recover in the near term.
Technical indicators:
Hourly MACD – The MACD is now losing pace in the bullish zone.
Hourly RSI (Relative Strength Index) – The RSI for BTC/USD is now above the 50 level.
Major Support Levels – $68,950, followed by $68,000.
Major Resistance Levels – $71,650 and $72,000.
[#item_full_content]NewsBTCRead MoreCryptoQuant says the cash cushion behind Strategy's STRC has thinned from seven years of coverage…
Bitcoin "OGs" have slashed their selling activity to the lowest levels in nearly two years.Read…
Trading firm Wintermute's options desk puts bitcoin in a $61,242 to $63,563 range for Tuesday,…
A renewed rout in semiconductor stocks pulled risk assets lower again, and crypto kept sliding.…
TL;DR South Korea’s KOSPI suffered a near-10% drop after regulators warned over leveraged ETF risk…
TL;DR US spot Bitcoin and Ether ETFs saw combined outflows of about $134 million for…