Ethereum gained pace and cleared the $1,200 zone against the US Dollar. ETH is up 8% and might continue to climb higher towards $1,300 or $1,320.
Ethereum extended gains and climbed above the $1,200 resistance zone.
The price is now trading above $1,200 and the 100 hourly simple moving average.
There is a crucial bullish trend line forming with support near $1,210 on the hourly chart of ETH/USD (data feed via Kraken).
The pair could continue to rise if it stays above the key $1,200 support zone.
Ethereum Price Gains Momentum
Ethereum remained well supported above the $1,120 level. The price started a fresh increase and was able to clear a major hurdle near the $1,150 level.
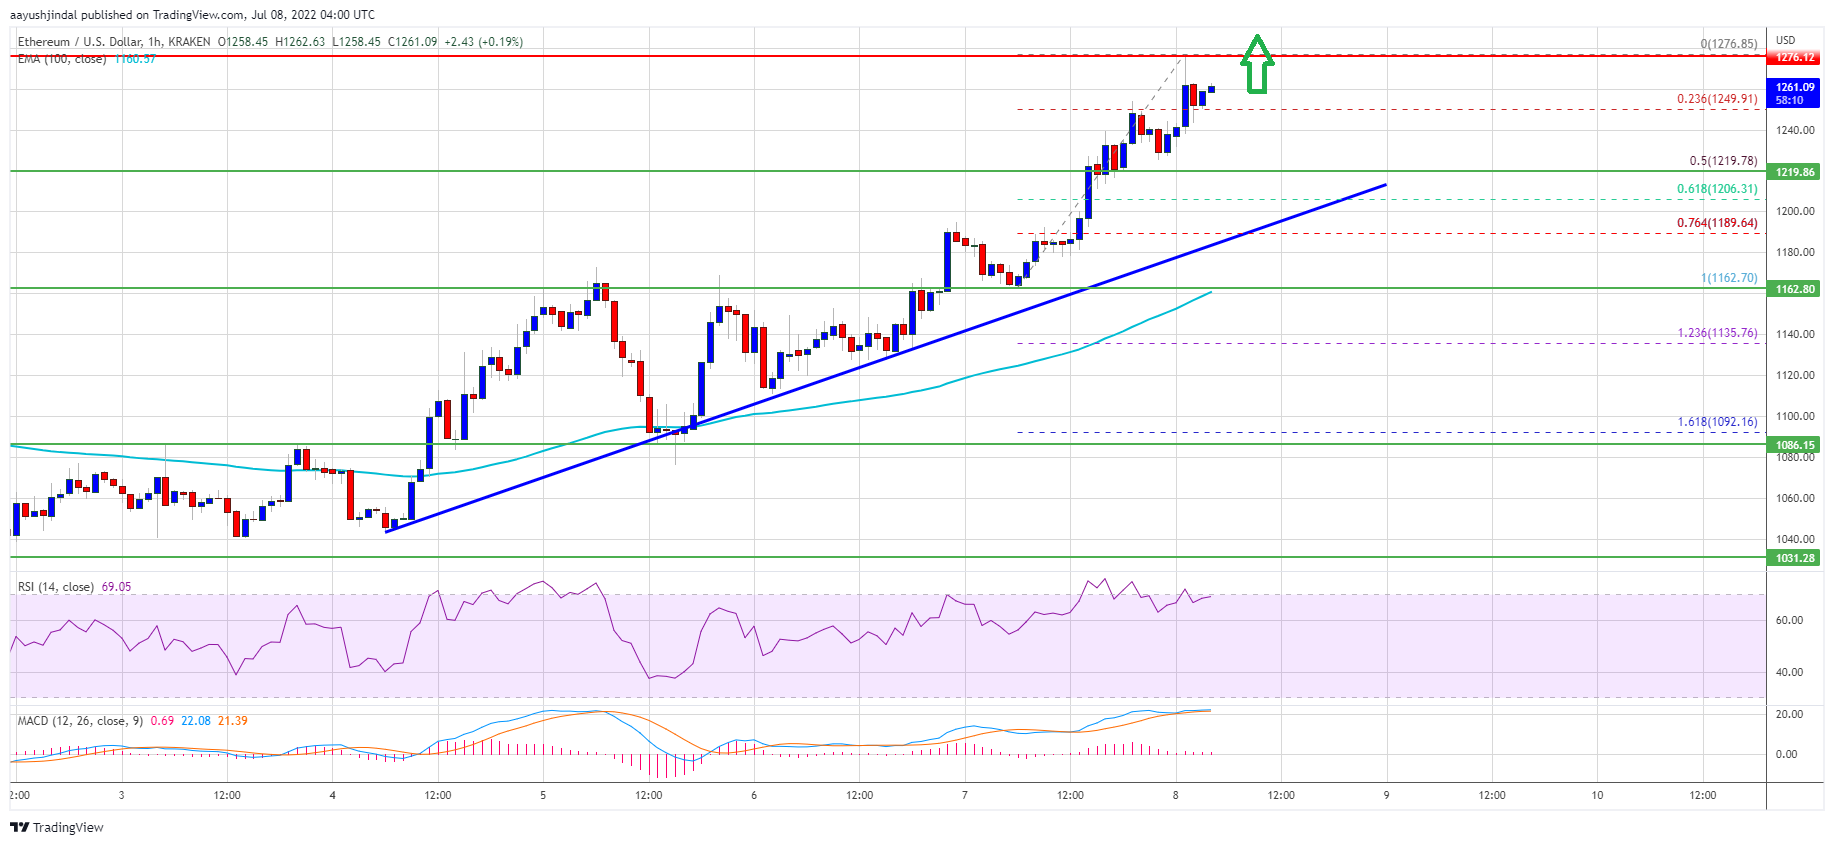
It opened the doors for a sharp increase above the $1,200 level. Ether price even broke the $1,250 level and traded to a new monthly high at $1,276. It is now trading above $1,200 and the 100 hourly simple moving average.
The price is testing the 23.6% Fib retracement level of the recent increase from the $1,162 swing low to $1,276 high. There is also a crucial bullish trend line forming with support near $1,210 on the hourly chart of ETH/USD. An immediate resistance on the upside is near the $1,275 level.
Source: ETHUSD on TradingView.com
The next major resistance is near the $1,320 zone, above which the price may perhaps gain strength. In the stated case, the price could rise towards the $1,350 resistance. If the bulls remain in action, the price might climb towards the $1,420 zone.
Dips Limited in ETH?
If ethereum fails to rise above the $1,275 resistance, it could start a downside correction. An initial support on the downside is near the $1,230 zone. The next major support is near the $1,210 zone. It is close to the 50% Fib retracement level of the recent increase from the $1,162 swing low to $1,276 high.
A downside break below the $1,210 support may perhaps send the price towards the 100 hourly simple moving average or $1,160. If the price fails to stay above the 100 hourly SMA, it could even slide towards the $1,120 level.
Technical Indicators
Hourly MACD – The MACD for ETH/USD is now gaining momentum in the bullish zone.
Hourly RSI – The RSI for ETH/USD is now well above the 50 level.
Major Support Level – $1,210
Major Resistance Level – $1,275
Ethereum gained pace and cleared the $1,200 zone against the US Dollar. ETH is up 8% and might continue to climb higher towards $1,300 or $1,320.
Ethereum extended gains and climbed above the $1,200 resistance zone.
The price is now trading above $1,200 and the 100 hourly simple moving average.
There is a crucial bullish trend line forming with support near $1,210 on the hourly chart of ETH/USD (data feed via Kraken).
The pair could continue to rise if it stays above the key $1,200 support zone.
Ethereum remained well supported above the $1,120 level. The price started a fresh increase and was able to clear a major hurdle near the $1,150 level.
It opened the doors for a sharp increase above the $1,200 level. Ether price even broke the $1,250 level and traded to a new monthly high at $1,276. It is now trading above $1,200 and the 100 hourly simple moving average.
The price is testing the 23.6% Fib retracement level of the recent increase from the $1,162 swing low to $1,276 high. There is also a crucial bullish trend line forming with support near $1,210 on the hourly chart of ETH/USD. An immediate resistance on the upside is near the $1,275 level.
Source: ETHUSD on TradingView.com
The next major resistance is near the $1,320 zone, above which the price may perhaps gain strength. In the stated case, the price could rise towards the $1,350 resistance. If the bulls remain in action, the price might climb towards the $1,420 zone.
If ethereum fails to rise above the $1,275 resistance, it could start a downside correction. An initial support on the downside is near the $1,230 zone. The next major support is near the $1,210 zone. It is close to the 50% Fib retracement level of the recent increase from the $1,162 swing low to $1,276 high.
A downside break below the $1,210 support may perhaps send the price towards the 100 hourly simple moving average or $1,160. If the price fails to stay above the 100 hourly SMA, it could even slide towards the $1,120 level.
Technical Indicators
Hourly MACD – The MACD for ETH/USD is now gaining momentum in the bullish zone.
Hourly RSI – The RSI for ETH/USD is now well above the 50 level.
Major Support Level – $1,210
Major Resistance Level – $1,275
FeedzyRead More
A key price level is giving Bitcoin trouble — and on-chain data may explain why.…
Strategy, formerly MicroStrategy, has crossed the 760,000 Bitcoin threshold with its latest purchase, bringing its…
Fed chair Jerome Powell said rising energy prices are feeding into the inflation outlook, but…
Bitcoin is starting to show intriguing signals on the monthly time frame, with long-term data…
Bitcoin Magazine Bitcoin Price Fights For $70,000 As Federal Reserve Holds Rates The Federal Reserve…
Bitcoin Magazine Till Death or Seed Phrase: Woman Accused of Spying on Husband, Stealing $172…