Bitcoin surged nearly 10% and broke the $22,000 resistance zone against the US Dollar. BTC could correct lower, but the bulls might be active near $21,250.
Bitcoin jumped and broke a major hurdle near the $22,000 zone.
The price is now trading above the $21,500 level and the 100 hourly simple moving average.
There was a break above a key rising channel with resistance near $21,125 on the hourly chart of the BTC/USD pair (data feed from Kraken).
The pair could correct lower, but the bulls might be able to protect the $21,250 support.
Bitcoin Price Starts Fresh Surge
Bitcoin price formed a base above the $20,000 level. BTC started a strong increase by clearing the $20,500 and $20,800 resistance levels.
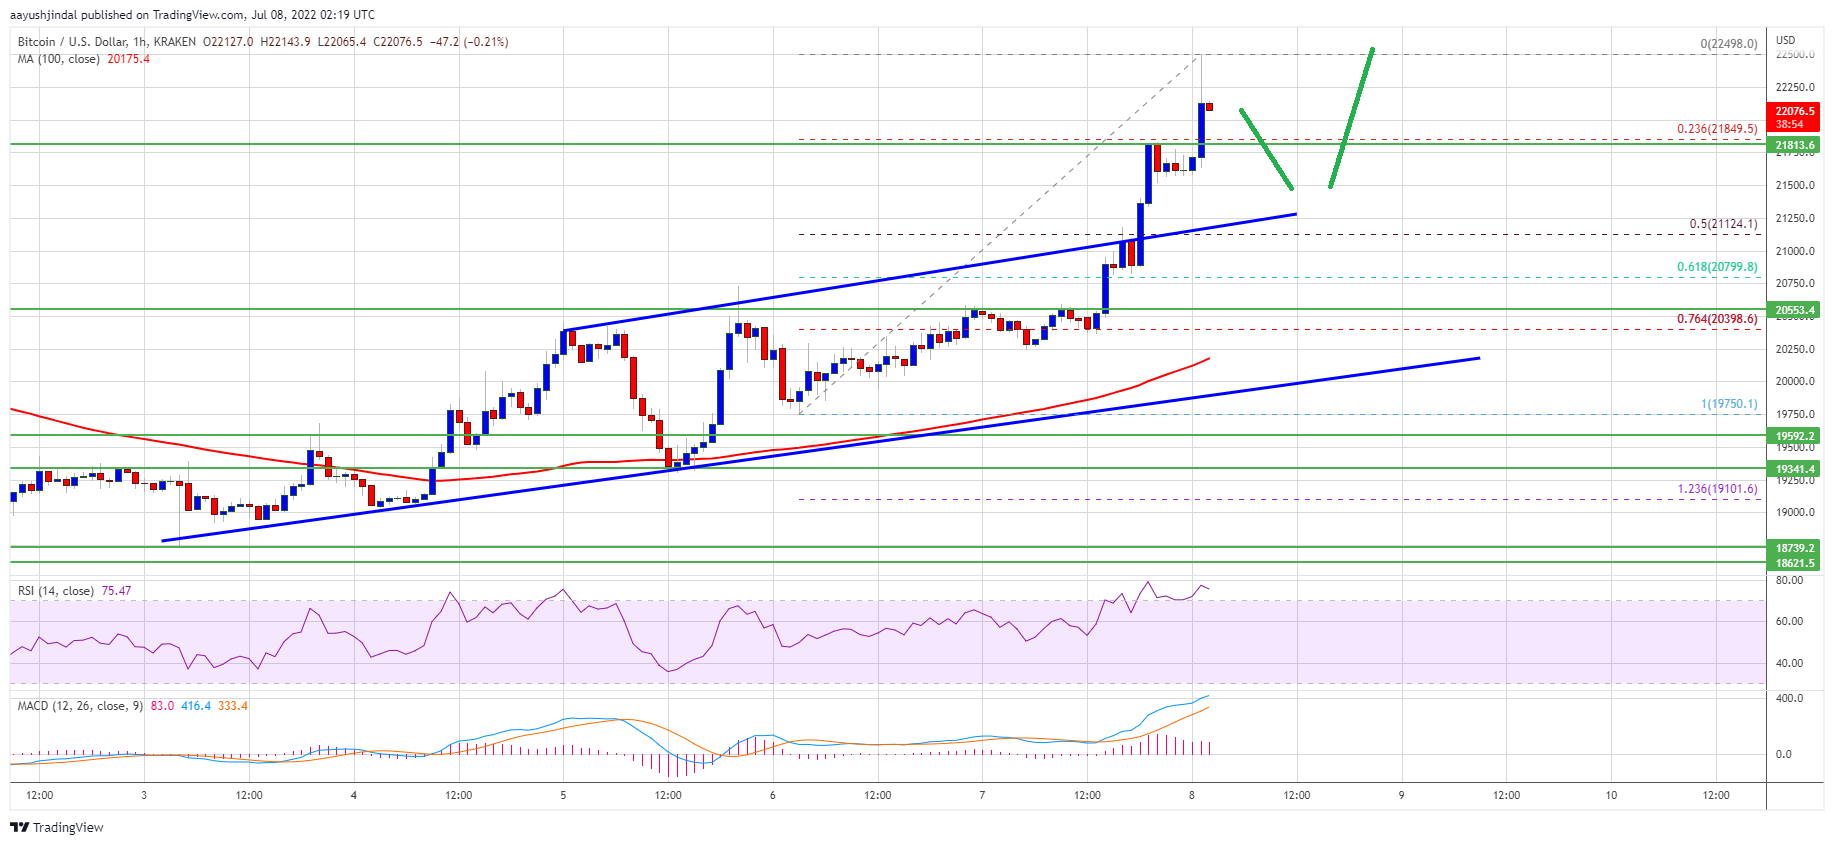
There was a sharp increase and the price climbed above the $21,500 level. It even broke the $22,000 hurdle and settled above the 100 hourly simple moving average. A high is formed near $22,498 and the price is now consolidating gains.
It is trading well above the 23.6% Fib retracement level of the recent increase from the $19,750 swing low to $22,498 high. On the upside, the price is facing resistance near the $22,450 and $22,500 levels.
Source: BTCUSD on TradingView.com
The next key resistance is near the $22,800 zone. A close above the $22,800 resistance zone could set the pace for a test of the $23,200 level. Any more gains might open the doors for an increase towards the $24,000 level. The next major resistance sits near the $25,000 level.
Dips Supported in BTC?
If bitcoin fails to clear the $22,500 resistance zone, it could start a downside correction. An immediate support on the downside is near the $21,850 level.
The next major support now sits near the $21,250 level or the broken channel trend line zone. It is near the 50% Fib retracement level of the recent increase from the $19,750 swing low to $22,498 high. A close below the $21,250 support zone could push the price to $20,500. In the stated case, there is a risk of a move towards the $20,000 level.
Technical indicators:
Hourly MACD – The MACD is now losing pace in the bullish zone.
Hourly RSI (Relative Strength Index) – The RSI for BTC/USD is now in the overbought zone.
Major Support Levels – $21,850, followed by $21,250.
Major Resistance Levels – $22,500, $22,800 and $23,200.
Bitcoin surged nearly 10% and broke the $22,000 resistance zone against the US Dollar. BTC could correct lower, but the bulls might be active near $21,250.
Bitcoin jumped and broke a major hurdle near the $22,000 zone.
The price is now trading above the $21,500 level and the 100 hourly simple moving average.
There was a break above a key rising channel with resistance near $21,125 on the hourly chart of the BTC/USD pair (data feed from Kraken).
The pair could correct lower, but the bulls might be able to protect the $21,250 support.
Bitcoin price formed a base above the $20,000 level. BTC started a strong increase by clearing the $20,500 and $20,800 resistance levels.
There was a sharp increase and the price climbed above the $21,500 level. It even broke the $22,000 hurdle and settled above the 100 hourly simple moving average. A high is formed near $22,498 and the price is now consolidating gains.
It is trading well above the 23.6% Fib retracement level of the recent increase from the $19,750 swing low to $22,498 high. On the upside, the price is facing resistance near the $22,450 and $22,500 levels.
Source: BTCUSD on TradingView.com
The next key resistance is near the $22,800 zone. A close above the $22,800 resistance zone could set the pace for a test of the $23,200 level. Any more gains might open the doors for an increase towards the $24,000 level. The next major resistance sits near the $25,000 level.
If bitcoin fails to clear the $22,500 resistance zone, it could start a downside correction. An immediate support on the downside is near the $21,850 level.
The next major support now sits near the $21,250 level or the broken channel trend line zone. It is near the 50% Fib retracement level of the recent increase from the $19,750 swing low to $22,498 high. A close below the $21,250 support zone could push the price to $20,500. In the stated case, there is a risk of a move towards the $20,000 level.
Technical indicators:
Hourly MACD – The MACD is now losing pace in the bullish zone.
Hourly RSI (Relative Strength Index) – The RSI for BTC/USD is now in the overbought zone.
Major Support Levels – $21,850, followed by $21,250.
Major Resistance Levels – $22,500, $22,800 and $23,200.
Tags: bitcoinbtcusdBTCUSDTxbtusd
FeedzyRead More
Semiconductor stocks led a second day of gains on AI optimism, while the yen slid…
Bitcoin Magazine Bitcoin Maxi Jack Dorsey Unveils New Open Source Group Chat App Tech entrepreneur…
Bitcoin Magazine Bitcoin is NOT Changed by Proof Of Node You might have heard about…
BTC has rebounded 15% from the July lows, but some analysts cautioned that the next…
The crypto financial services firm is funding developers to strengthen the blockchain's security before quantum…
Claude Fabel 5 disproved the Jacobian conjecture over the weekend, landing days after the capabilities…