Bitcoin failed to continue higher above $31,750 against the US Dollar. BTC declined sharply and traded below the $30,000 support zone.
Bitcoin started a fresh decline from the $31,750 region.
The price is now trading below the $30,000 level and the 100 hourly simple moving average.
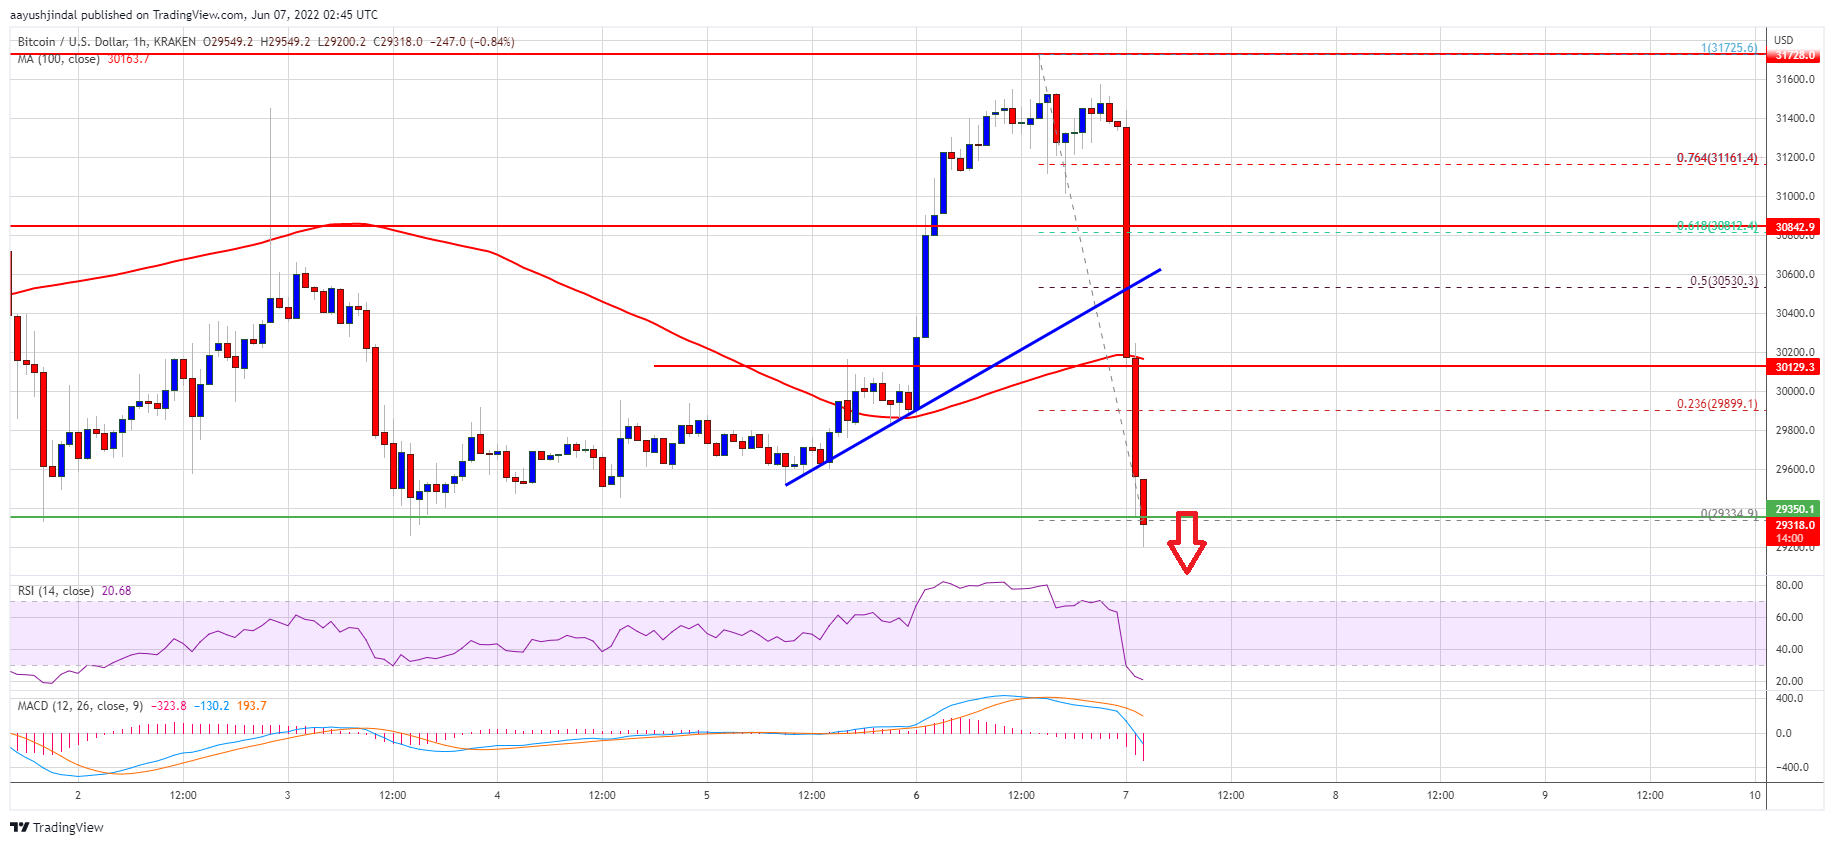
There was a break below a key bullish trend line with support near $30,500 on the hourly chart of the BTC/USD pair (data feed from Kraken).
The pair could continue to move down towards $28,500 or even $28,000.
Bitcoin Price Dives 6%
Bitcoin price extended increase above the $31,400 resistance zone. However, BTC struggled to even test the $32,000 resistance zone. A high was formed near $31,725 and the price started a fresh decline.
There was a strong move below the $31,000 and $30,500 support levels. Besides, there was a break below a key bullish trend line with support near $30,500 on the hourly chart of the BTC/USD pair. The pair is now trading below the $30,000 level and the 100 hourly simple moving average.
The bears are now attempting a clear move below the $29,350 support zone. An immediate resistance on the upside is near the $29,600 level. The first major resistance is near the $29,900 level. It is near the 23.6% Fib retracement level of the recent decline from the $31,725 swing high to $29,300 low.
Source: BTCUSD on TradingView.com
The next major resistance is near the $30,120 level. A clear move above the $30,120 resistance level could send the price towards the 50% Fib retracement level of the recent decline from the $31,725 swing high to $29,300 low. Any more gains might change the bias and bitcoin price could rise towards the $31,200 level.
More Losses in BTC?
If bitcoin fails to recover above the $30,000 resistance zone, it could continue to move down. An immediate support on the downside is near the $29,200 level.
The next major support is near the $28,500 level. A downside break below the $28,500 support may perhaps spark another decline. In the stated case, the price could dive towards the $27,200 support zone in the near term.
Technical indicators:
Hourly MACD – The MACD is now gaining pace in the bearish zone.
Hourly RSI (Relative Strength Index) – The RSI for BTC/USD is now well below the 40 level.
Major Support Levels – $29,000, followed by $28,500.
Major Resistance Levels – $29,900, $30,120 and $30,500.
Bitcoin failed to continue higher above $31,750 against the US Dollar. BTC declined sharply and traded below the $30,000 support zone.
Bitcoin started a fresh decline from the $31,750 region.
The price is now trading below the $30,000 level and the 100 hourly simple moving average.
There was a break below a key bullish trend line with support near $30,500 on the hourly chart of the BTC/USD pair (data feed from Kraken).
The pair could continue to move down towards $28,500 or even $28,000.
Bitcoin price extended increase above the $31,400 resistance zone. However, BTC struggled to even test the $32,000 resistance zone. A high was formed near $31,725 and the price started a fresh decline.
There was a strong move below the $31,000 and $30,500 support levels. Besides, there was a break below a key bullish trend line with support near $30,500 on the hourly chart of the BTC/USD pair. The pair is now trading below the $30,000 level and the 100 hourly simple moving average.
The bears are now attempting a clear move below the $29,350 support zone. An immediate resistance on the upside is near the $29,600 level. The first major resistance is near the $29,900 level. It is near the 23.6% Fib retracement level of the recent decline from the $31,725 swing high to $29,300 low.
Source: BTCUSD on TradingView.com
The next major resistance is near the $30,120 level. A clear move above the $30,120 resistance level could send the price towards the 50% Fib retracement level of the recent decline from the $31,725 swing high to $29,300 low. Any more gains might change the bias and bitcoin price could rise towards the $31,200 level.
If bitcoin fails to recover above the $30,000 resistance zone, it could continue to move down. An immediate support on the downside is near the $29,200 level.
The next major support is near the $28,500 level. A downside break below the $28,500 support may perhaps spark another decline. In the stated case, the price could dive towards the $27,200 support zone in the near term.
Technical indicators:
Hourly MACD – The MACD is now gaining pace in the bearish zone.
Hourly RSI (Relative Strength Index) – The RSI for BTC/USD is now well below the 40 level.
Major Support Levels – $29,000, followed by $28,500.
Major Resistance Levels – $29,900, $30,120 and $30,500.
Tags: bitcoinbtcusdBTCUSDTxbtusd
FeedzyRead More
Bitcoin matched Monday's high near $87,300 before running into selling, while citcoin cash surged 28%…
Thirty-eight of the 100 CoinDesk 100 constituents were lower on the day, with bitcoin cash…
Coinbase now allows users to borrow the USDC stablecoin against their bitcoin at a fixed…
Bitcoin’s 10% September gain puts it on track for a rare three-month winning streak last…
Falling oil eased inflation worries through the Asian session, while a bill to make the…
Bitcoin Magazine Bitcoin Investors Buy Nearly $1B in BTC ETFs as Bull Market Returns The…