Bitcoin failed again to clear the $30,600 resistance zone against the US Dollar. BTC is declining, but the bulls might remain active near $28,500.
Bitcoin failed to gain strength for a move above the $30,600 resistance zone.
The price is now trading below the $30,000 level and the 100 hourly simple moving average.
There was break below a major bullish trend line with support near $29,800 on the hourly chart of the BTC/USD pair (data feed from Kraken).
The pair could continue to move down towards the main $28,700 support zone.
Bitcoin Price Tops Again
Bitcoin price attempted a fresh increase from the $28,500 support zone. There was a clear move above $30,000 resistance zone and the 100 hourly simple moving average.
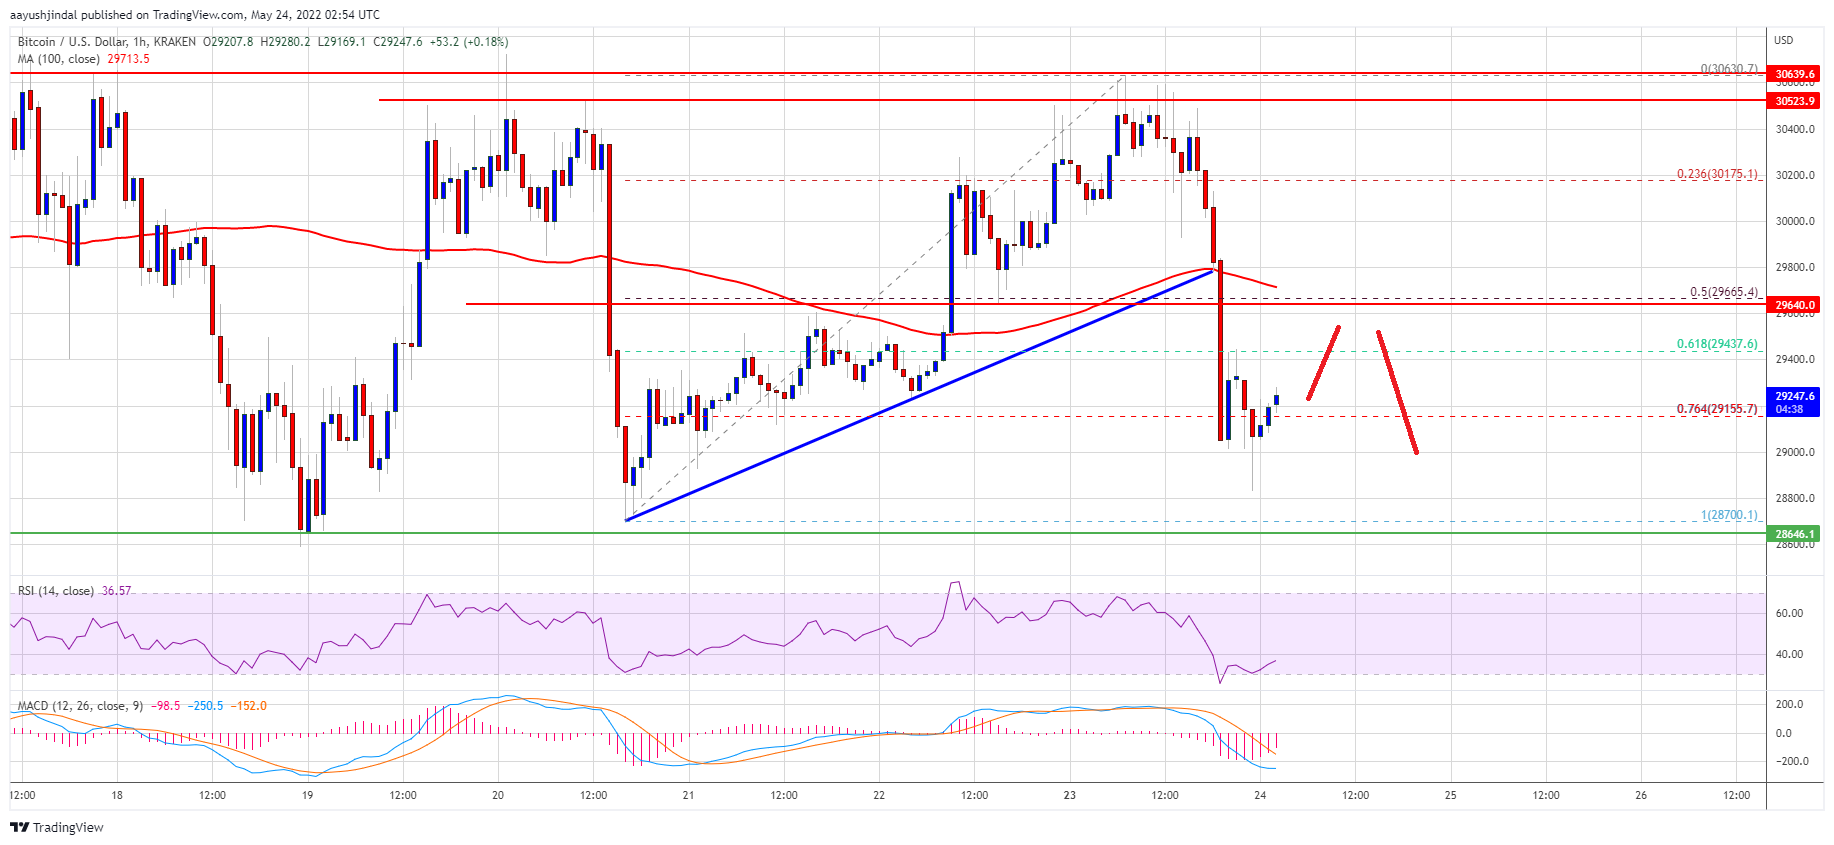
However, the bears were again active near the $30,600 resistance zone. A high was formed near $30,630 and the price started another decline. There was a sharp reaction below the $30,000 support zone and the 100 hourly simple moving average.
Bitcoin traded below the 50% Fib retracement level of the upward move from the $28,700 swing low to $30,630 high. Besides, there was break below a major bullish trend line with support near $29,800 on the hourly chart of the BTC/USD pair.
The price even spiked below the 76.4% Fib retracement level of the upward move from the $28,700 swing low to $30,630 high. It is now consolidating, with an immediate resistance near the $29,500 level.
Source: BTCUSD on TradingView.com
The next major resistance is near the $29,650 level and the 100 hourly SMA. The first key resistance is near the $30,000 level. A clear move above the $30,000 resistance level might send the price towards the main $30,600 resistance zone.
More Losses in BTC?
If bitcoin fails to clear the $29,650 resistance zone, it could continue to move down. An immediate support on the downside is near the $29,000 level.
The first major support is near the $28,850 level. The main support sits near the $28,500 level. A clear move below the $28,500 support zone may perhaps start a major decline. In the stated case, the price could dive to $27,800.
Technical indicators:
Hourly MACD – The MACD is now slowly losing pace in the bearish zone.
Hourly RSI (Relative Strength Index) – The RSI for BTC/USD is now below the 50 level.
Major Support Levels – $28,850, followed by $28,500.
Major Resistance Levels – $29,650, $30,000 and $30,600.
Bitcoin failed again to clear the $30,600 resistance zone against the US Dollar. BTC is declining, but the bulls might remain active near $28,500.
Bitcoin failed to gain strength for a move above the $30,600 resistance zone.
The price is now trading below the $30,000 level and the 100 hourly simple moving average.
There was break below a major bullish trend line with support near $29,800 on the hourly chart of the BTC/USD pair (data feed from Kraken).
The pair could continue to move down towards the main $28,700 support zone.
Bitcoin price attempted a fresh increase from the $28,500 support zone. There was a clear move above $30,000 resistance zone and the 100 hourly simple moving average.
However, the bears were again active near the $30,600 resistance zone. A high was formed near $30,630 and the price started another decline. There was a sharp reaction below the $30,000 support zone and the 100 hourly simple moving average.
Bitcoin traded below the 50% Fib retracement level of the upward move from the $28,700 swing low to $30,630 high. Besides, there was break below a major bullish trend line with support near $29,800 on the hourly chart of the BTC/USD pair.
The price even spiked below the 76.4% Fib retracement level of the upward move from the $28,700 swing low to $30,630 high. It is now consolidating, with an immediate resistance near the $29,500 level.
Source: BTCUSD on TradingView.com
The next major resistance is near the $29,650 level and the 100 hourly SMA. The first key resistance is near the $30,000 level. A clear move above the $30,000 resistance level might send the price towards the main $30,600 resistance zone.
If bitcoin fails to clear the $29,650 resistance zone, it could continue to move down. An immediate support on the downside is near the $29,000 level.
The first major support is near the $28,850 level. The main support sits near the $28,500 level. A clear move below the $28,500 support zone may perhaps start a major decline. In the stated case, the price could dive to $27,800.
Technical indicators:
Hourly MACD – The MACD is now slowly losing pace in the bearish zone.
Hourly RSI (Relative Strength Index) – The RSI for BTC/USD is now below the 50 level.
Major Support Levels – $28,850, followed by $28,500.
Major Resistance Levels – $29,650, $30,000 and $30,600.
Tags: bitcoinbtcusdBTCUSDTxbtusd
FeedzyRead More
According to on-chain analyst Willy Woo, a long-running rise in Bitcoin’s value versus gold has…
Strategy says it can withstand a bitcoin price drop to $8,000 and still cover its…
Bitcoin is sitting at a “critical point,” with traders split between two familiar scripts: a…
According to Strategy founder Michael Saylor, the company believes it could meet its obligations even…
Traders are bracing for a heavy week of macroeconomic events, including Fed minutes and the…
Bitcoin price failed to stay above $70,000 and started another decline. BTC is now trading…