Bitcoin price failed to stay above $70,000 and started another decline. BTC is now trading below $68,800 and might extend losses in the near term.
Bitcoin is slowly moving lower below $69,500 and $69,200.
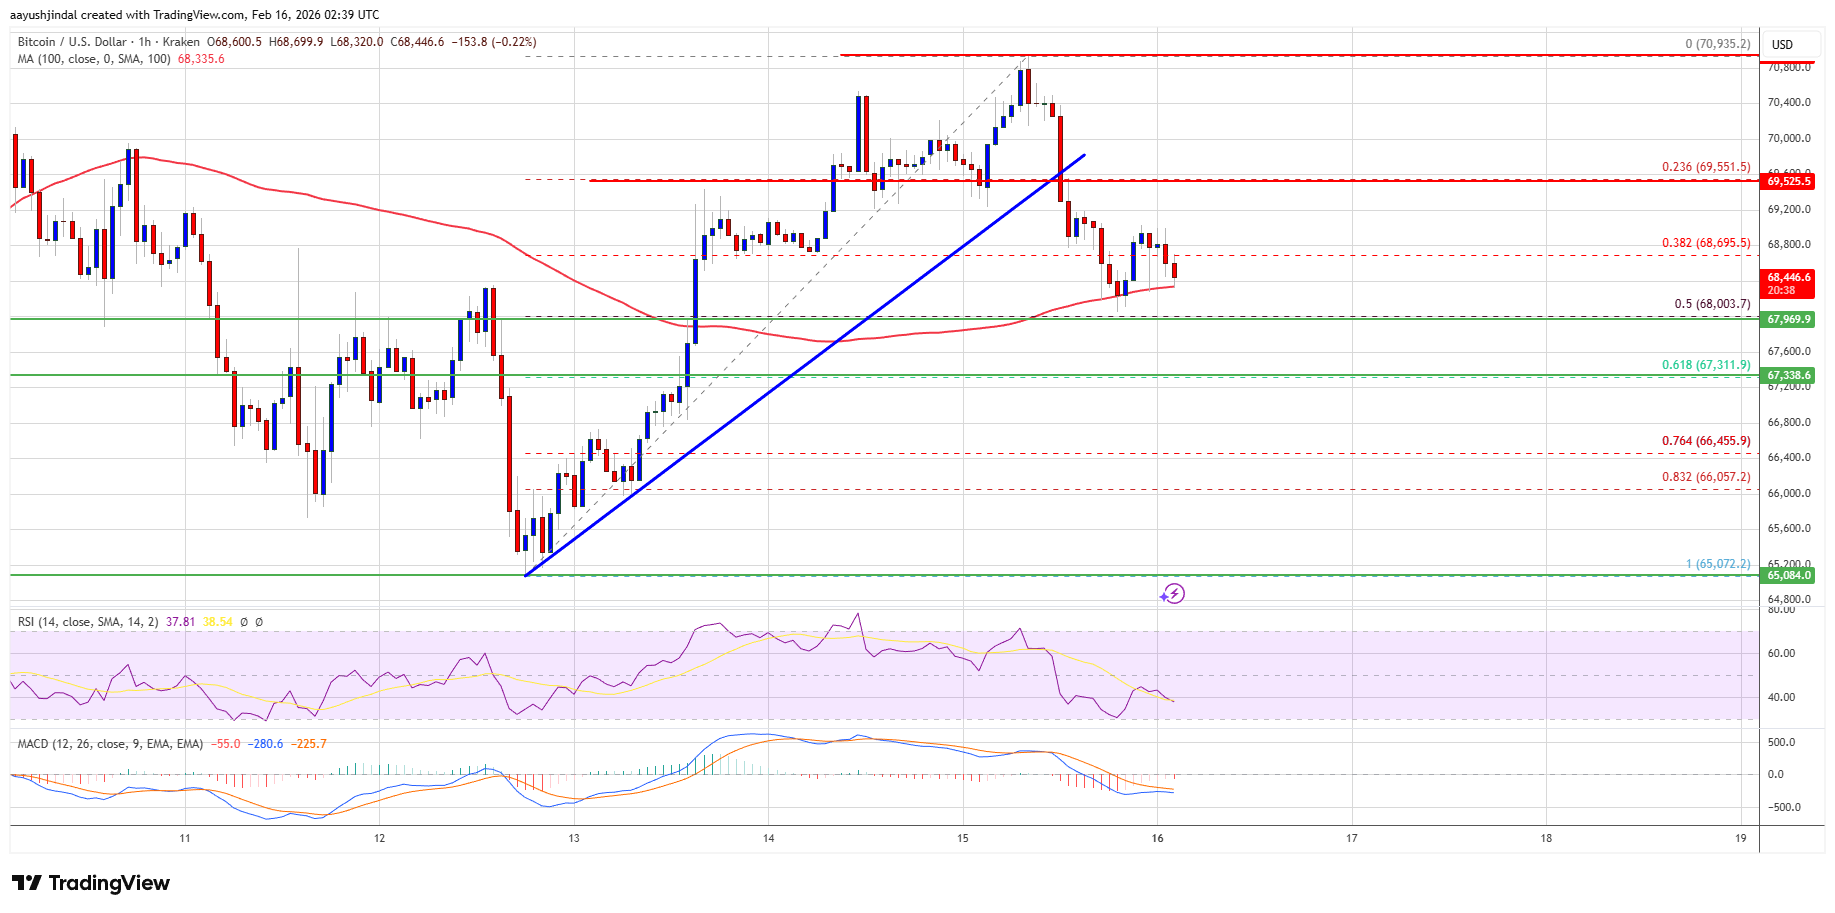
The price is trading near $68,400 and the 100 hourly simple moving average.
There was a break below a bullish trend line with support at $69,500 on the hourly chart of the BTC/USD pair (data feed from Kraken).
The pair might dip again if it trades below the $68,400 and $68,000 levels.
Bitcoin price failed to remain stable above the $70,000 zone. BTC started a fresh decline and traded below the $69,200 support zone. There was a push below $69,000.
The price dipped below the 38.2% Fib retracement level of the upward move from the $65,072 swing low to the $70,935 high. Besides, there was a break below a bullish trend line with support at $69,500 on the hourly chart of the BTC/USD pair.
Bitcoin is now trading near $68,400 and the 100 hourly simple moving average. If the price remains stable above $68,000, it could attempt a fresh increase. Immediate resistance is near the $68,800 level.
The first key resistance is near the $69,500 level. A close above the $69,500 resistance might send the price further higher. In the stated case, the price could rise and test the $70,000 resistance. Any more gains might send the price toward the $70,500 level. The next barrier for the bulls could be $72,000 and $72,500.
If Bitcoin fails to rise above the $69,500 resistance zone, it could start another decline. Immediate support is near the $68,200 level. The first major support is near the $68,000 level or the 50% Fib retracement level of the upward move from the $65,072 swing low to the $70,935 high.
The next support is now near the $67,350 zone. Any more losses might send the price toward the $67,350 support in the near term. The main support now sits at $66,500, below which BTC might struggle to recover in the near term.
Technical indicators:
Hourly MACD – The MACD is now gaining pace in the bearish zone.
Hourly RSI (Relative Strength Index) – The RSI for BTC/USD is now below the 50 level.
Major Support Levels – $68,000, followed by $66,500.
Major Resistance Levels – $69,500 and $70,000.
[#item_full_content]NewsBTCRead MoreThe popular max pain theory isn’t working out as bitcoin trades far from the $72K…
A liquidation flush took bitcoin to its lowest since early June before Micron's blowout earnings…
The market has found a new support level and it could be tested following Thursday's…
The token fell to about $59,000 before buyers stepped in, but the week's losses are…
Bitcoin Magazine Strategy (MSTR) Stock Craters 10%, Hits Two-Year Low as Bitcoin Crashes Below $60K,…
Bitcoin Magazine Bitcoin Price Collapses to $59,000 — and the Worst May Not Be Over…