Bitcoin is showing positive signs above $39,500 against the US Dollar. BTC must clear $40,250 to continue higher in the near term.
Bitcoin started another recovery wave and climbed above the $39,800 level.
The price is now trading above $39,500 and the 100 hourly simple moving average.
There is a major bullish trend line forming with support near $39,580 on the hourly chart of the BTC/USD pair (data feed from Kraken).
The pair must clear the $40,250 resistance to continue higher in the near term.
Bitcoin Price Eyes Upside Break
Bitcoin price started a fresh recovery wave above the $38,500 resistance level. BTC cleared the $39,250 and $39,500 resistance levels to move into a positive zone.
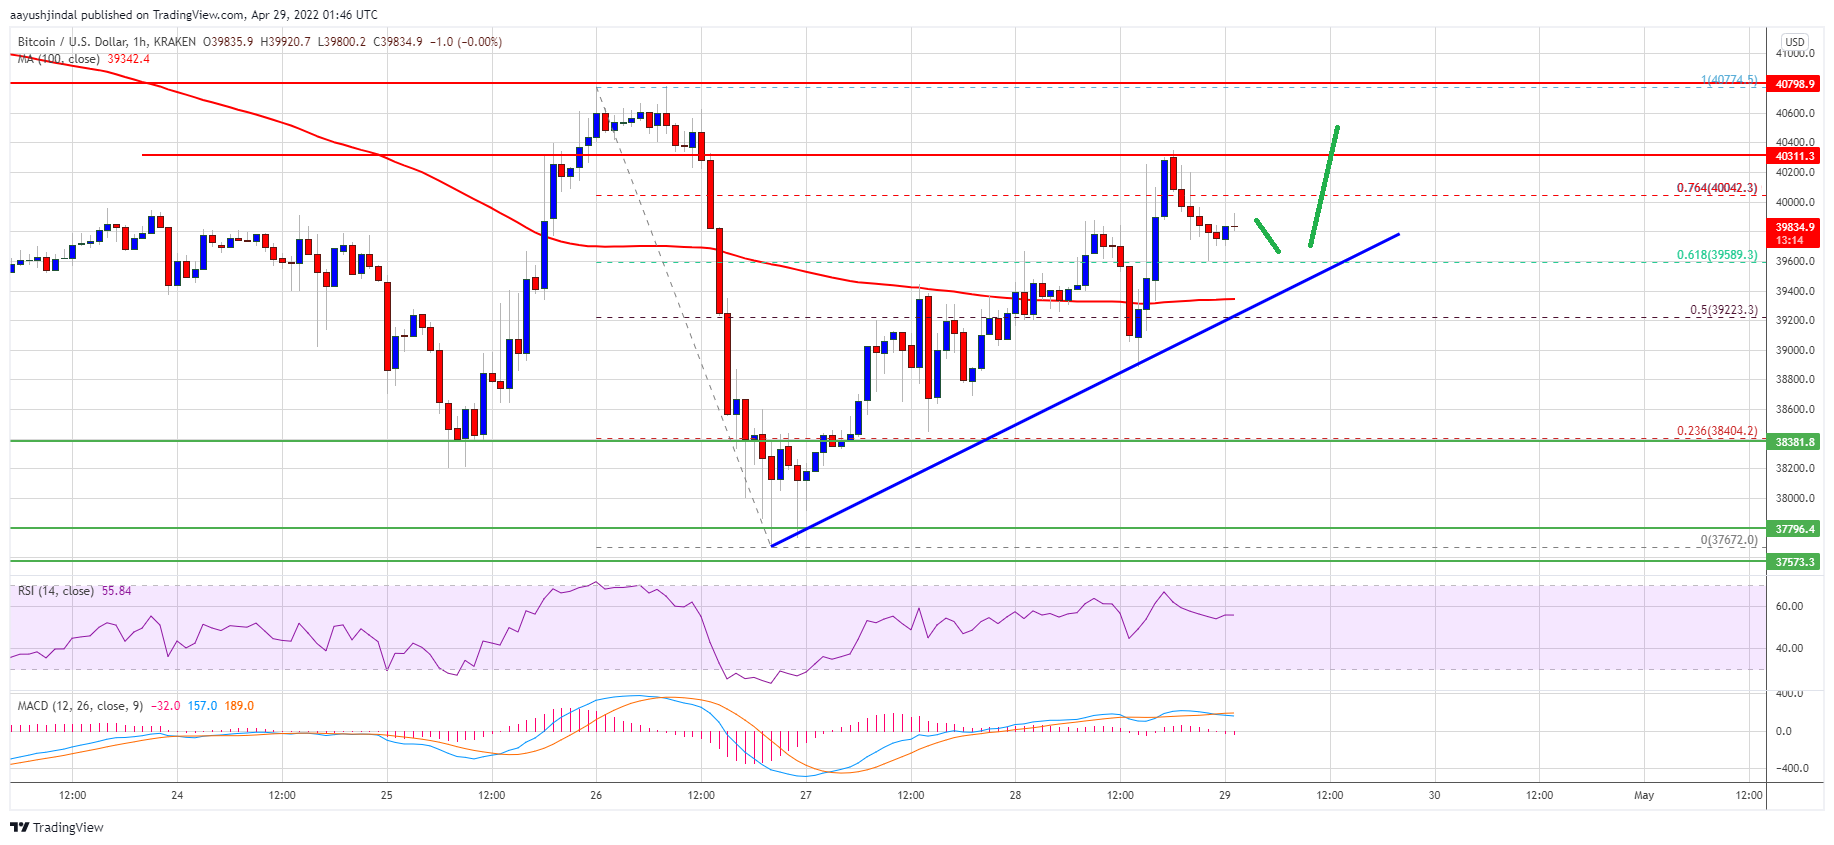
There was a move above the 50% Fib retracement level of the main decline from the $40,774 swing high to $37,670 swing low. There is also a major bullish trend line forming with support near $39,580 on the hourly chart of the BTC/USD pair.
Bitcoin price is now trading above $39,500 and the 100 hourly simple moving average. It even spiked above the $40,000 resistance.
However, there was no close above the 76.4% Fib retracement level of the main decline from the $40,774 swing high to $37,670 swing low. On the upside, an immediate resistance is near the $40,000 level. The next key resistance could be near the $40,250 zone.
Source: BTCUSD on TradingView.com
A close above the $40,250 level could open the doors for a decent increase. In the stated case, the price could even surpass the $40,800 resistance. The next major resistance may perhaps be near the $41,250 zone.
Fresh Decline in BTC?
If bitcoin fails to clear the $40,250 resistance zone, it could start a fresh decline. An immediate support on the downside is near the $39,750 level.
The next major support is seen near the trend line and $39,580. A clear break below the trend line support and $39,500 could open the doors for a fresh decline. In this case, the price may perhaps decline towards the $39,000 level. Any more losses might call for a test of the $38,400 support.
Technical indicators:
Hourly MACD – The MACD is slowly losing pace in the bullish zone.
Hourly RSI (Relative Strength Index) – The RSI for BTC/USD is now above the 50 level.
Major Support Levels – $39,580, followed by $38,400.
Major Resistance Levels – $40,250, $40,800 and $41,250.
Bitcoin is showing positive signs above $39,500 against the US Dollar. BTC must clear $40,250 to continue higher in the near term.
Bitcoin started another recovery wave and climbed above the $39,800 level.
The price is now trading above $39,500 and the 100 hourly simple moving average.
There is a major bullish trend line forming with support near $39,580 on the hourly chart of the BTC/USD pair (data feed from Kraken).
The pair must clear the $40,250 resistance to continue higher in the near term.
Bitcoin price started a fresh recovery wave above the $38,500 resistance level. BTC cleared the $39,250 and $39,500 resistance levels to move into a positive zone.
There was a move above the 50% Fib retracement level of the main decline from the $40,774 swing high to $37,670 swing low. There is also a major bullish trend line forming with support near $39,580 on the hourly chart of the BTC/USD pair.
Bitcoin price is now trading above $39,500 and the 100 hourly simple moving average. It even spiked above the $40,000 resistance.
However, there was no close above the 76.4% Fib retracement level of the main decline from the $40,774 swing high to $37,670 swing low. On the upside, an immediate resistance is near the $40,000 level. The next key resistance could be near the $40,250 zone.
Source: BTCUSD on TradingView.com
A close above the $40,250 level could open the doors for a decent increase. In the stated case, the price could even surpass the $40,800 resistance. The next major resistance may perhaps be near the $41,250 zone.
If bitcoin fails to clear the $40,250 resistance zone, it could start a fresh decline. An immediate support on the downside is near the $39,750 level.
The next major support is seen near the trend line and $39,580. A clear break below the trend line support and $39,500 could open the doors for a fresh decline. In this case, the price may perhaps decline towards the $39,000 level. Any more losses might call for a test of the $38,400 support.
Technical indicators:
Hourly MACD – The MACD is slowly losing pace in the bullish zone.
Hourly RSI (Relative Strength Index) – The RSI for BTC/USD is now above the 50 level.
Major Support Levels – $39,580, followed by $38,400.
Major Resistance Levels – $40,250, $40,800 and $41,250.
Tags: bitcoinbtcusdBTCUSDTxbtusd
FeedzyRead More
Michael Saylor says Strategy aims to make STRC the world's best credit instrument after the…
The move suggests a greater willingness on the part of Michael Saylor and Strategy to…
Bitcoin Magazine OranjeBTC Adds 20 BTC to Treasury, Hits 2.20% BTC Yield for 2026 OranjeBTC,…
The 8-K filing by Strategy Monday disclosed sales for the period May 26 to May…
Bitcoin Magazine ProCap Financial (BRR) Sells 52 Bitcoin to Fund Two-Million-Share Buyback at 50% NAV…
Your day-ahead look for June 1, 2026Read MoreCoinDesk: Bitcoin, Ethereum, Crypto News and Price Data[#item_full_content]