Ethereum price is still struggling to climb again above $2,250 while Bitcoin broke $43,500. ETH is showing a few concerning signs and might take a major hit.
Ethereum is struggling to gain pace for a move above the $2,250 resistance zone.
The price is trading below $2,220 and the 100-hourly Simple Moving Average.
There is a key bullish trend line forming with support near $2,170 on the hourly chart of ETH/USD (data feed via Kraken).
The pair could decline heavily if it stays below $2,250 for a long time.
Ethereum price made another attempt to clear the $2,250 and $2,265 resistance levels. However, ETH failed to settle above the $2,250 resistance. There are clearly more than two rejections noted near the $2,250 and $2,265 levels.
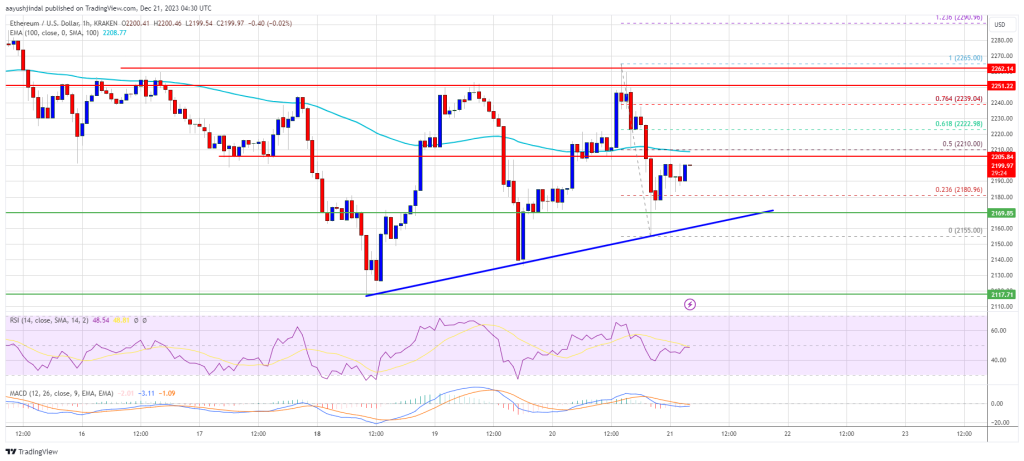
On the other hand, Bitcoin gained pace for a move above the $43,500 resistance. This could be a warning sign for ETH bulls. The recent low was formed near $2,155 and the price is now consolidating. It is above the 23.6% Fib retracement level of the recent decline from the $2,265 swing high to the $2,155 low.
There is also a key bullish trend line forming with support near $2,170 on the hourly chart of ETH/USD. Ethereum is now trading below $2,220 and the 100-hourly Simple Moving Average.
On the upside, the price is facing resistance near the $2,210 level. It is close to the 50% Fib retracement level of the recent decline from the $2,265 swing high to the $2,155 low. The next key resistance is near the $2,250 level or $2,265. A clear move above the $2,2650 zone could send the price toward the $2,320 level.
Source: ETHUSD on TradingView.com
The next resistance sits at $2,365. Any more gains could start a wave toward the $2,450 level, above which Ethereum might rally and test the $2,500 zone.
If Ethereum fails to clear the $2,250 resistance, it could start another decline. Initial support on the downside is near the $2,170 level and the trend line.
The first key support could be the $2,120 zone. A downside break and a close below $2,120 might spark strong bearish moves. In the stated case, Ether could revisit the $2,000 support. Any more losses might send the price toward the $1,880 level in the coming sessions.
Technical Indicators
Hourly MACD – The MACD for ETH/USD is losing momentum in the bullish zone.
Hourly RSI – The RSI for ETH/USD is now below the 50 level.
Major Support Level – $2,170
Major Resistance Level – $2,250
[#item_full_content]NewsBTCRead MoreData shows the Bitcoin perpetual futures market has seen a negative Funding Rate recently, suggesting…
Despite the crypto market’s renewed weakness on Thursday, a new AI-driven market model produced by…
The recent price action echoes the November–January pattern, showing weak conviction among the “buy the…
Morgan Stanley has filed to launch a spot Bitcoin ETF with the ticker MSBT and…
Oil prices slipped as major economies announced joint efforts to stabilize energy markets.Read MoreCoinDesk: Bitcoin,…
BTQ Technologies moved a key Bitcoin (BTC) security proposal from theory to practice on Thursday,…