Bitcoin price is moving higher and recently broke the $43,500 resistance. BTC is still in a strong uptrend and might gain pace for a move above $45,000.
Bitcoin extended its increase and climbed above the $43,500 resistance zone.
The price is trading above $43,000 and the 100 hourly Simple moving average.
There is a connecting bullish trend line forming with support near $43,100 on the hourly chart of the BTC/USD pair (data feed from Kraken).
The pair could continue to move up if there is a close above $44,500 and $45,000.
Bitcoin price remained stable above the $42,000 resistance zone. BTC gained bullish momentum and climbed above the $43,000 resistance zone. It even cleared the key $43,500 barrier.
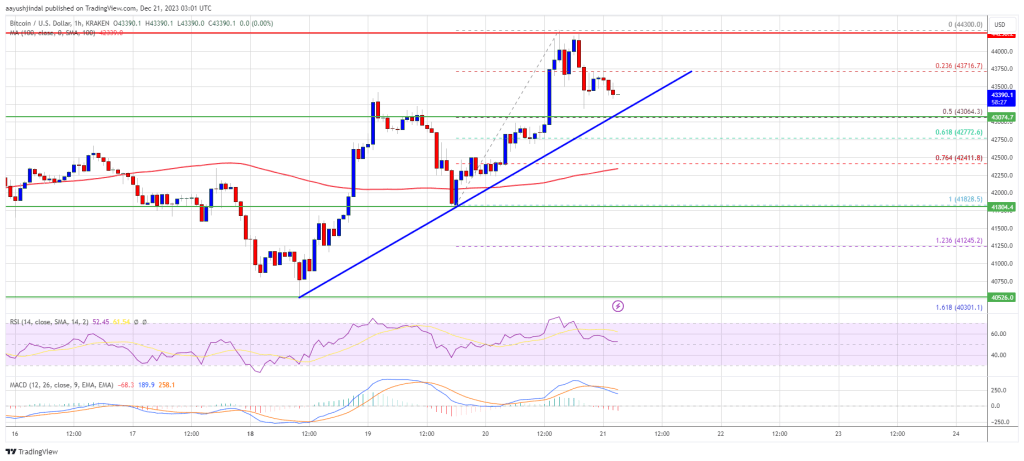
Finally, the price tested the $44,300 level. A high is formed near $44,300 and the price is now correcting gains. There was a minor decline below the $44,000 level. The price dipped below the 23.6% Fib retracement level of the recent increase from the $41,828 swing low to the $44,300 high.
Bitcoin is now trading above $43,000 and the 100 hourly Simple moving average. There is also a connecting bullish trend line forming with support near $43,100 on the hourly chart of the BTC/USD pair.
The current price action and the recent breakout calls for more gains. On the upside, immediate resistance is near the $44,000 level. The first major resistance is forming near $44,300 and $44,500. A close above the $44,500 resistance could set the pace for a move above $45,000.
Source: BTCUSD on TradingView.com
The next key resistance could be near $46,500, above which BTC could rise toward the $47,200 level. The next major target for the bulls could be $48,000.
If Bitcoin fails to rise above the $44,500 resistance zone, it could continue to move down. Immediate support on the downside is near the $43,200 level.
The next major support is near $43,000 or the 50% Fib retracement level of the recent increase from the $41,828 swing low to the $44,300 high. If there is a move below $43,000, there is a risk of more losses. In the stated case, the price could drop toward the $42,000 support in the near term.
Technical indicators:
Hourly MACD – The MACD is now gaining pace in the bullish zone.
Hourly RSI (Relative Strength Index) – The RSI for BTC/USD is now above the 50 level.
Major Support Levels – $43,100, followed by $43,000.
Major Resistance Levels – $44,300, $44,500, and $45,000.
[#item_full_content]NewsBTCRead MoreBitcoin Magazine Wavespace Launches MiCA-Compliant Self-Custodial Bitcoin Debit Card Powered by Lightning and NWC Wavespace,…
For readers tracking where the market is actually changing, this is the part that matters.…
The headline number is useful, but the real story is what it says about positioning.…
Miners must redirect their hashrate before the July 31 cutoff, as the pool will stop…
The Nasdaq-listed Korean media company once lined up $1 billion in financing to buy 10,000…
The bank said Strategy's bitcoin sales policy adds avoidable market uncertainty and should be replaced…