Bitcoin price started a strong increase above the $71,500 zone. BTC is consolidating gains and might aim for more gains above the $73,250 zone.
Bitcoin gained pace for a move above the $71,500 and $72,000 levels.
The price is trading above $71,500 and the 100 hourly simple moving average.
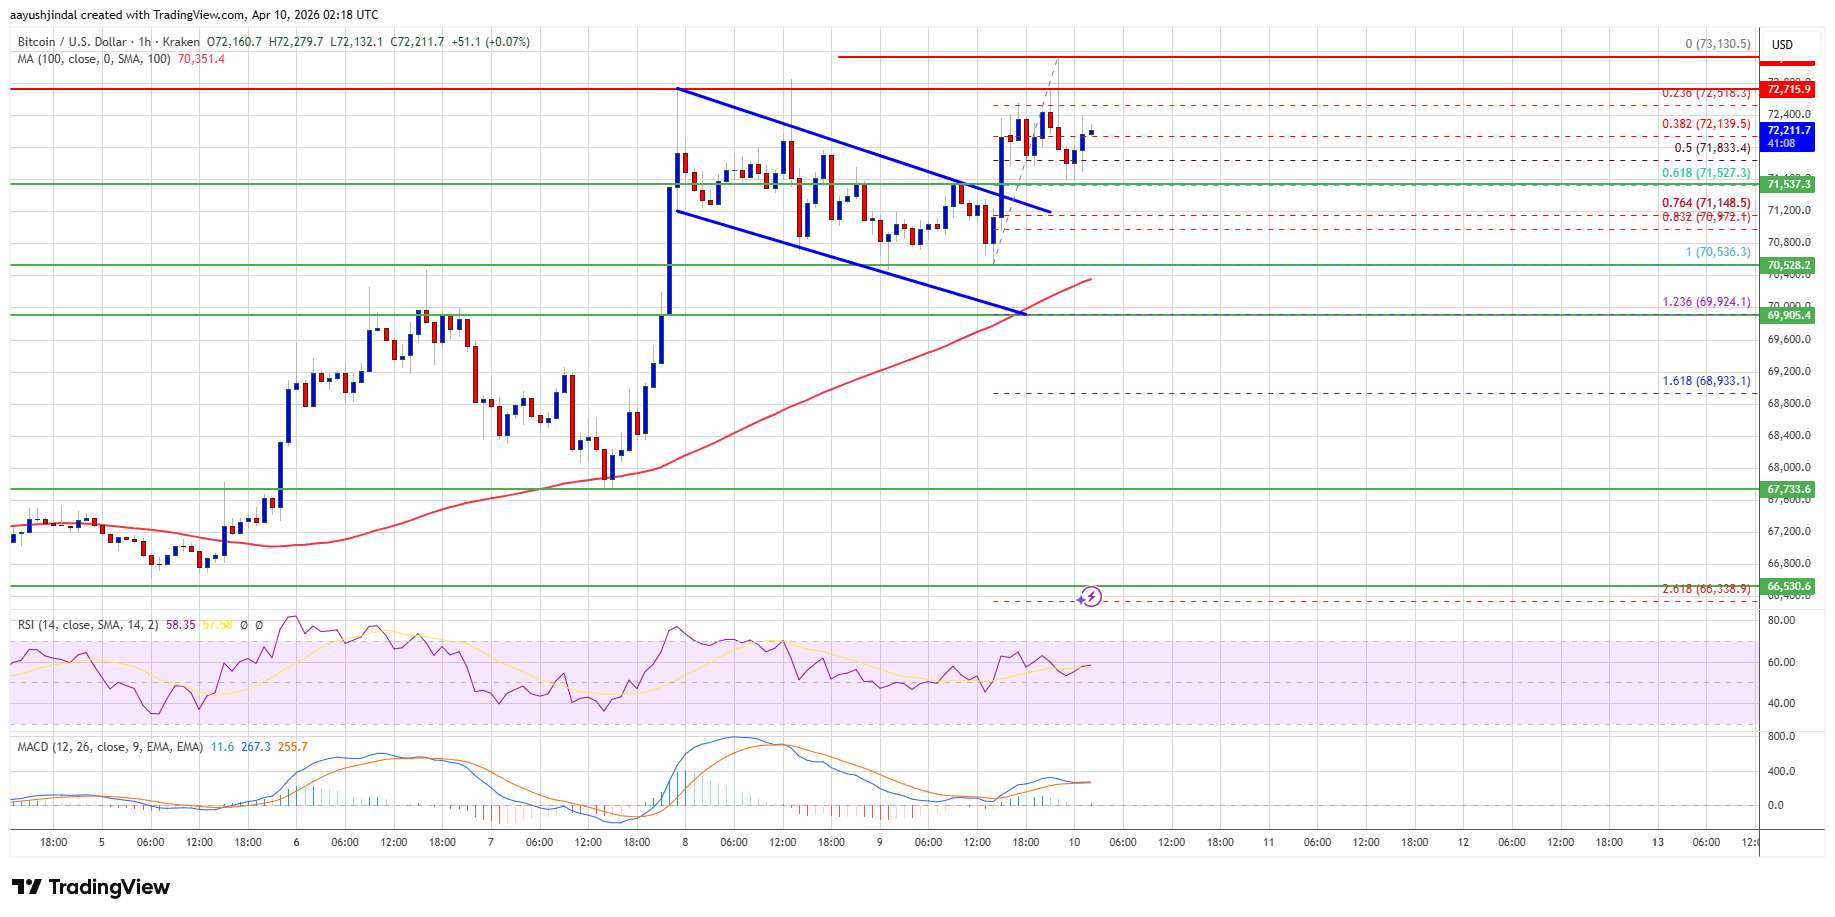
There was a break above a bullish flag pattern with resistance at $71,250 on the hourly chart of the BTC/USD pair (data feed from Kraken).
The pair might extend gains if it stays above the $71,500 and $71,250 levels.
Bitcoin price managed to climb higher above the $70,500 resistance zone. BTC gained pace for a move above the $71,500 and $72,000 levels.
The pair even rallied above the $72,500 level. Besides, there was a break above a bullish flag pattern with resistance at $71,250 on the hourly chart of the BTC/USD pair. A high was formed at $73,130, and the price started a downside correction. There was a move below the 50% Fib retracement level of the upward move from the $70,536 swing low to the $73,130 high.
However, the bulls were active above $71,500. Bitcoin is now trading above $72,000 and the 100 hourly simple moving average. If the price remains stable above $71,500, it could attempt a fresh increase. Immediate resistance is near the $72,500 level.
The first key resistance is near the $73,250 level. A close above the $73,250 resistance might send the price further higher. In the stated case, the price could rise and test the $74,000 resistance. Any more gains might send the price toward the $74,500 level. The next barrier for the bulls could be $75,000.
If Bitcoin fails to rise above the $73,250 resistance zone, it could start another decline. Immediate support is near the $71,500 level or the 61.8% Fib retracement level of the upward move from the $70,536 swing low to the $73,130 high.
The first major support is near the $71,250 level. The next support is now near the $70,500 zone. Any more losses might send the price toward the $70,000 support in the near term. The main support now sits at $69,500, below which BTC might struggle to recover in the near term.
Technical indicators:
Hourly MACD – The MACD is now gaining pace in the bullish zone.
Hourly RSI (Relative Strength Index) – The RSI for BTC/USD is now above the 50 level.
Major Support Levels – $71,500, followed by $71,250.
Major Resistance Levels – $72,500 and $73,250.
[#item_full_content]NewsBTCRead MoreBitcoin is back above $70,000 after a bruising first quarter, but there are still questions…
Eased Middle East tensions pushed crypto prices and U.S. stocks sizable hjigher.Read MoreCoinDesk: Bitcoin, Ethereum,…
Bitcoin Magazine Bitcoin Could Be Quantum-Safe Without Protocol Changes, New Proposal Claims A new research…
Analyst Lance Vitanza is betting that digital asset treasury"companies like Nakamoto, SharpLink and Strive can…
Wall Street’s financial advisory machine now has a direct line to Bitcoin. Morgan Stanley Investment…
Crypto markets are showing early signs that the worst may be over, following a prolonged…