Bitcoin price found support and started a decent increase above $43,000. BTC is rising, but it might struggle to clear the $44,300 and $44,500 resistance levels.
Bitcoin tested the $41,650 zone an started a fresh increase.
The price is trading above $43,000 and the 100 hourly Simple moving average.
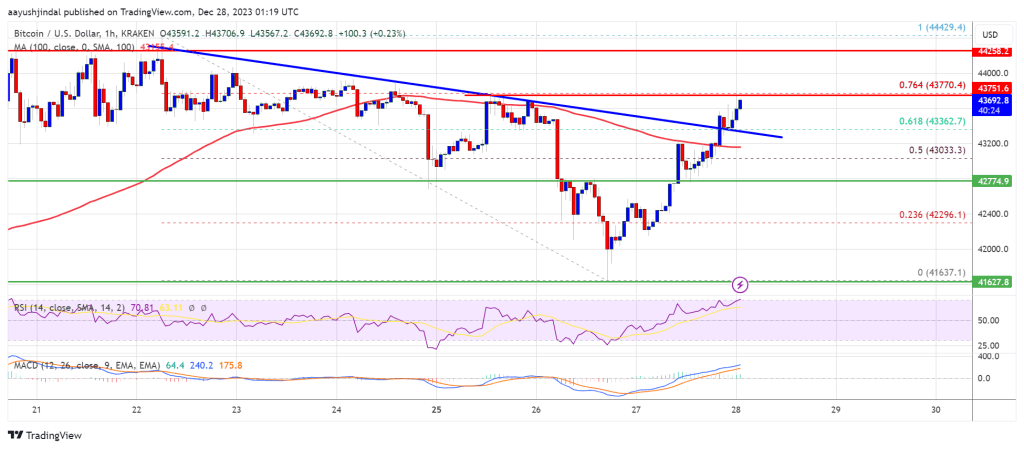
There was a break above a connecting bearish trend line with resistance near $43,350 on the hourly chart of the BTC/USD pair (data feed from Kraken).
The pair could continue to move surge toward the main resistance at $44,300.
Bitcoin price was able to find bids above the $41,500 level. BTC formed a base and recently started a fresh increase from the $41,637 low. There was a steady increase above the $42,500 resistance zone.
There was a break above a connecting bearish trend line with resistance near $43,350 on the hourly chart of the BTC/USD pair. The pair even climbed above the 61.8% Fib retracement level of the downward move from the $44,429 swing high to the $41,636 low.
Bitcoin is now trading above $43,000 and the 100 hourly Simple moving average. On the upside, immediate resistance is near the $43,780 level. It is close to the 76.4% Fib retracement level of the downward move from the $44,429 swing high to the $41,636 low.
Source: BTCUSD on TradingView.com
The first major resistance is $44,000. The main hurdle sits at $44,300. A close above the $44,300 resistance could start a decent move toward the $45,000 level. The next key resistance could be near $45,500, above which BTC could rise toward the $46,500 level.
If Bitcoin fails to rise above the $44,000 resistance zone, it could start a fresh decline. Immediate support on the downside is near the $43,350 level.
The next major support is near $42,750. If there is a move below $42,750, there is a risk of more losses. In the stated case, the price could drop toward the $42,000 support in the near term.
Technical indicators:
Hourly MACD – The MACD is now gaining pace in the bullish zone.
Hourly RSI (Relative Strength Index) – The RSI for BTC/USD is now above the 50 level.
Major Support Levels – $43,350, followed by $42,750.
Major Resistance Levels – $43,750, $44,000, and $44,300.
[#item_full_content]NewsBTCRead MoreBrent crude slid nearly 12% on Monday to trade around $94, but market expert Sam…
Bitcoin price started a recovery wave above $69,200. BTC is now back above $70,000 and…
Bitcoin Magazine U.S. Senator Cynthia Lummis Confirmed As A Bitcoin 2026 Speaker U.S. Senator Cynthia…
An Israeli TV report said a one-month ceasefire could be announced soon.Read MoreCoinDesk: Bitcoin, Ethereum,…
Bitcoin’s halving clock is ticking toward what analysts call a critical threshold — and the…
Bitcoin Magazine Morgan Stanley is Pushing Bitcoin and Crypto, But Says Wall Street Isn’t Chasing…