Bitcoin price started a recovery wave above $69,200. BTC is now back above $70,000 and might aim for a steady increase if it clears $71,650.
Bitcoin started a decent recovery wave above $69,500 and $70,000.
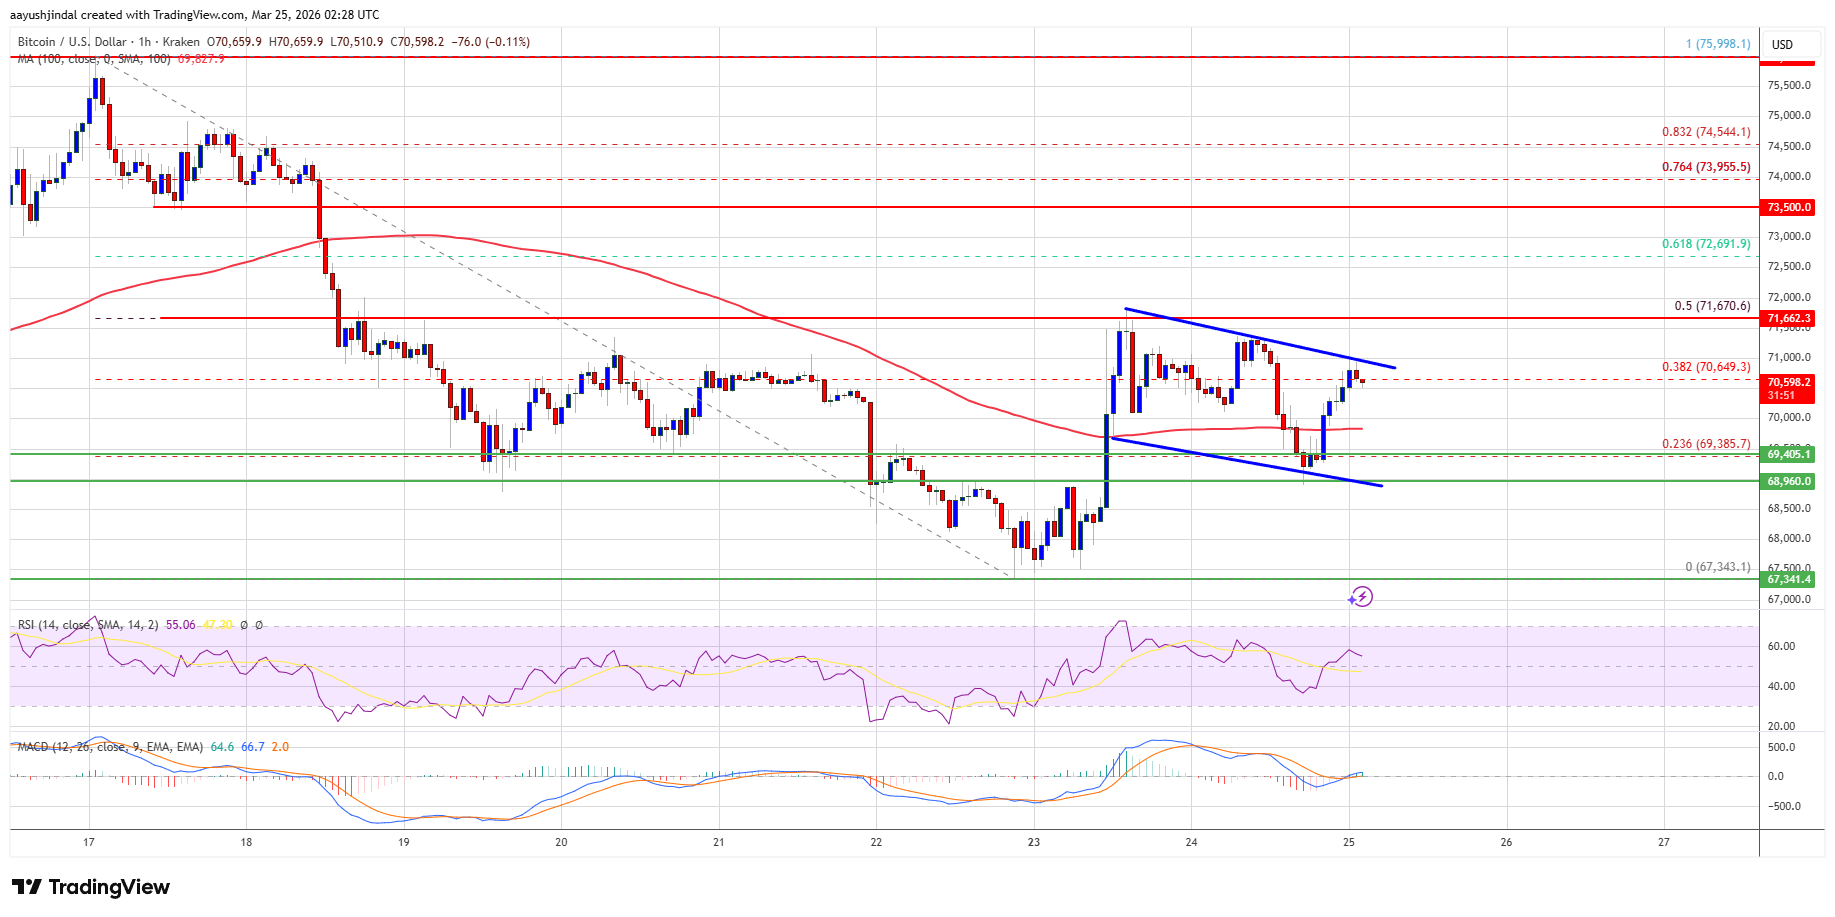
The price is trading above $70,000 and the 100 hourly simple moving average.
There is a bullish flag pattern forming with resistance at $70,700 on the hourly chart of the BTC/USD pair (data feed from Kraken).
The pair might start another decline if it stays below the $71,200 and $71,650 levels.
Bitcoin price started a recovery wave above the $68,800 pivot level. BTC climbed above the $69,200 and $69,500 resistance levels.
The bulls were able to push the price above the 38.2% Fib retracement level of the downward move from the $75,997 swing high to the $67,343 low. The price even climbed above $71,200 before the bears appeared near the $71,650 level.
Bitcoin is now trading above $70,000 and the 100 hourly simple moving average. If the price remains stable above $69,500, it could attempt a fresh increase. Immediate resistance is near the $70,700 level. There is also a bullish flag pattern forming with resistance at $70,700 on the hourly chart of the BTC/USD pair.
The first key resistance is near the $71,650 level or the 50% Fib retracement level of the downward move from the $75,997 swing high to the $67,343 low. A close above the $71,650 resistance might send the price further higher. In the stated case, the price could rise and test the $72,500 resistance. Any more gains might send the price toward the $73,200 level. The next barrier for the bulls could be $73,500.
If Bitcoin fails to rise above the $71,650 resistance zone, it could start another decline. Immediate support is near the $70,000 level. The first major support is near the $69,500 level.
The next support is now near the $69,000 zone. Any more losses might send the price toward the $68,200 support in the near term. The main support now sits at $67,500, below which BTC might struggle to recover in the near term.
Technical indicators:
Hourly MACD – The MACD is now losing pace in the bullish zone.
Hourly RSI (Relative Strength Index) – The RSI for BTC/USD is now above the 50 level.
Major Support Levels – $69,500, followed by $69,000.
Major Resistance Levels – $70,700 and $71,650.
[#item_full_content]NewsBTCRead MoreA 50% drop from recent highs has pushed the asset into a zone historically labeled…
Bitcoin Magazine Bitcoin Price Crashes Toward $61,000 as Bloodbath Engulfs Crypto Stocks Bitcoin price is…
A strengthening U.S. dollar and the Fed's hawkish turn under new chair Kevin Warsh may…
Precious metals have fallen sharply from their 2025 highs as markets price in Fed rate…
Bitcoin Magazine BlackRock Tells Investors to Put Bitcoin in Their Portfolios BlackRock, the world’s largest…
Bitcoin Magazine Strive (ASST) CEO Says Company Is Buying Bitcoin ‘Hand Over Fist’ as Treasury…