Bitcoin price took a hit and even spiked below $60,000. BTC could gain bearish momentum if there is a daily close below the $60,000 support zone.
Bitcoin started another decline and traded below the $61,200 zone.
The price is trading below $62,000 and the 100 hourly Simple moving average.
There is a connecting bearish trend line forming with resistance at $60,400 on the hourly chart of the BTC/USD pair (data feed from Kraken).
The pair could accelerate lower if it fails to recover above $60,400 and then $62,000 this week.
Bitcoin price started another decline below the $62,500 support level. BTC dropped below the $61,200 level as the bears took control. They even managed to push the price below $60,000.
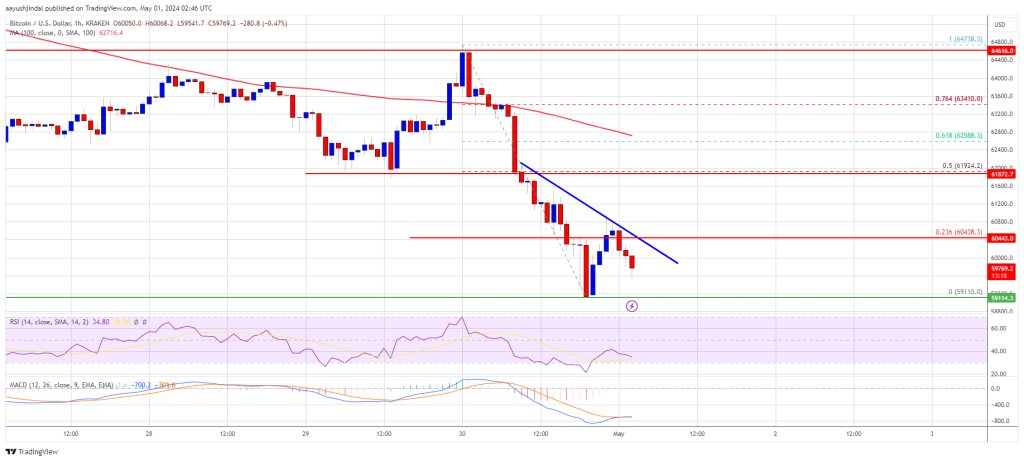
A low was formed at $59,110 and the price is now consolidating losses. There was a minor increase above the $60,000 level and the 23.6% Fib retracement level of the recent decline from the $64,738 swing high to the $59,110 low.
Bitcoin is now trading below $61,500 and the 100 hourly Simple moving average. Immediate resistance is near the $60,400 level. There is also a connecting bearish trend line forming with resistance at $60,400 on the hourly chart of the BTC/USD pair.
The first major resistance could be $61,200. The next key resistance could be $62,000 or the 50% Fib retracement level of the recent decline from the $64,738 swing high to the $59,110 low.
Source: BTCUSD on TradingView.com
A clear move above the $62,000 resistance might send the price higher. The next resistance now sits at $62,500. If there is a clear move above the $62,500 resistance zone, the price could continue to move up. In the stated case, the price could rise toward $64,000.
If Bitcoin fails to rise above the $60,400 resistance zone, it could continue to move down. Immediate support on the downside is near the $59,500 level.
The first major support is $59,100. If there is a close below $59,100, the price could start to drop toward $58,000. Any more losses might send the price toward the $56,400 support zone in the near term.
Technical indicators:
Hourly MACD – The MACD is now gaining pace in the bearish zone.
Hourly RSI (Relative Strength Index) – The RSI for BTC/USD is now below the 50 level.
Major Support Levels – $59,500, followed by $59,100.
Major Resistance Levels – $60,400, $61,200, and $62,000.
[#item_full_content]NewsBTCRead MoreBitcoin price started a strong increase above the $71,500 zone. BTC is consolidating gains and…
Bitcoin is back above $70,000 after a bruising first quarter, but there are still questions…
Eased Middle East tensions pushed crypto prices and U.S. stocks sizable hjigher.Read MoreCoinDesk: Bitcoin, Ethereum,…
Bitcoin Magazine Bitcoin Could Be Quantum-Safe Without Protocol Changes, New Proposal Claims A new research…
Analyst Lance Vitanza is betting that digital asset treasury"companies like Nakamoto, SharpLink and Strive can…
Wall Street’s financial advisory machine now has a direct line to Bitcoin. Morgan Stanley Investment…