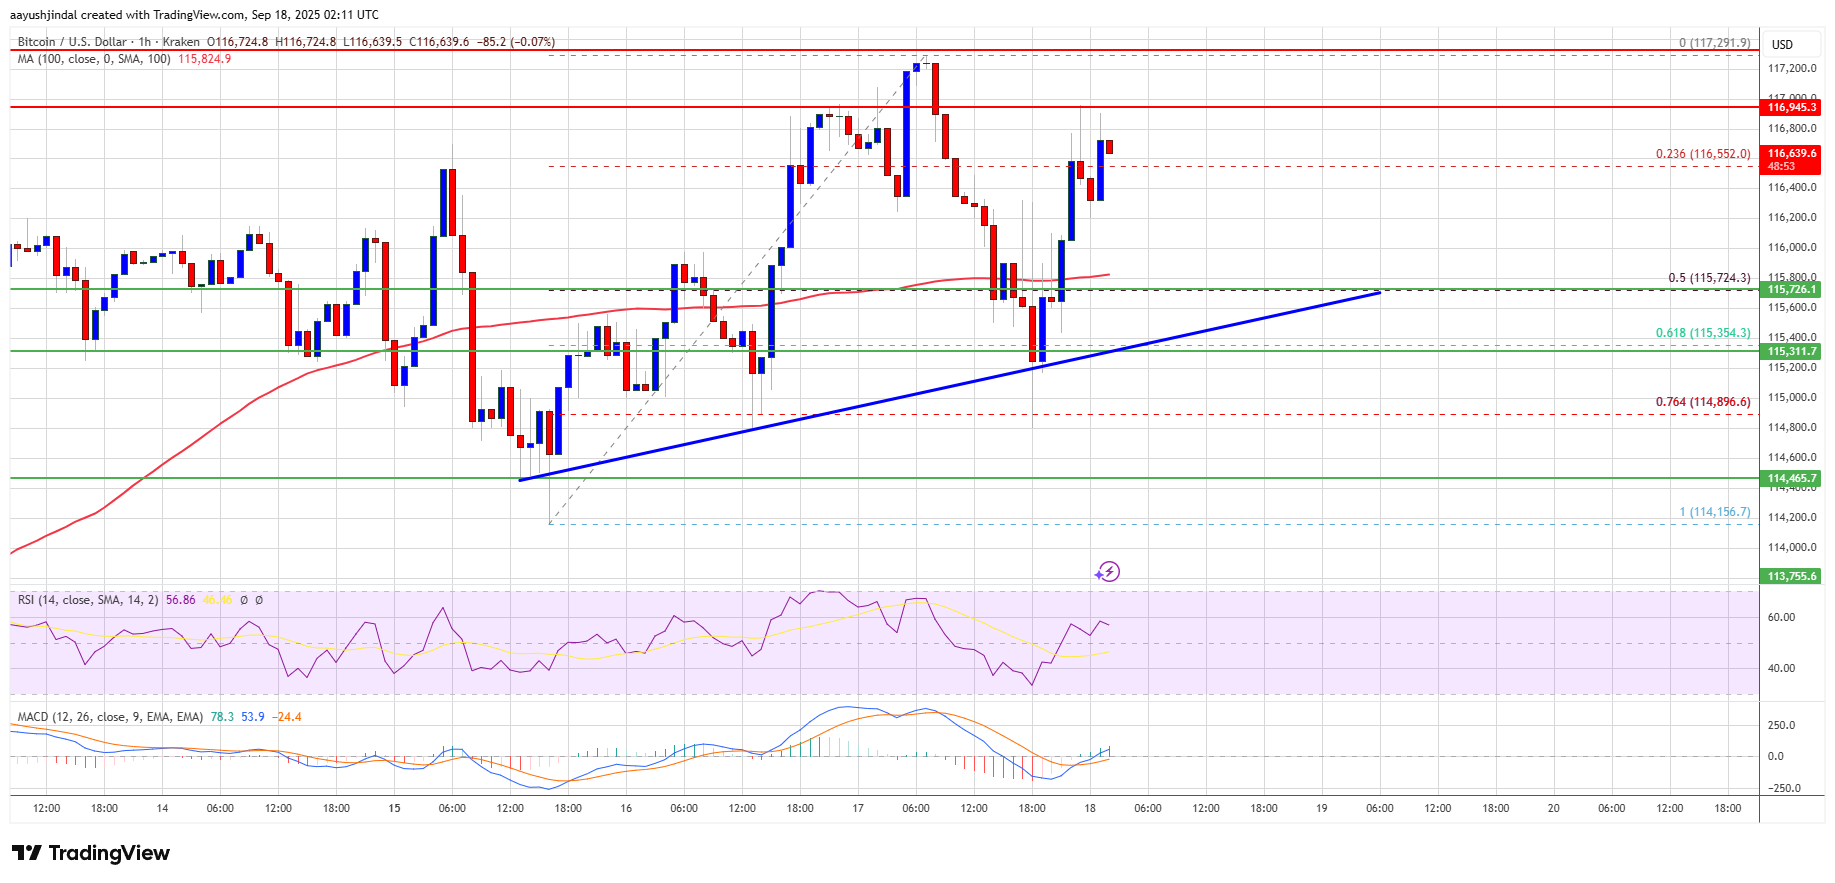
Bitcoin price is moving higher above $116,500. BTC is now facing hurdles and might gain bullish momentum if it clears the $117,250 resistance zone.
Bitcoin started a fresh increase above the $116,200 zone.
The price is trading below $116,200 and the 100 hourly Simple moving average.
There is a key bullish trend line forming with support at $115,500 on the hourly chart of the BTC/USD pair (data feed from Kraken).
The pair might start another increase if it clears the $117,250 zone.
Bitcoin price started a fresh upward wave above the $115,500 zone. BTC managed to climb above the $116,000 and $116,200 resistance levels.
The bulls were able to push the price above $117,000. The price traded as high as $117,291 and recently started a downside correction. There was a move below the $116,800 level. The price dipped below the 50% Fib retracement level of the recent move from the $114,157 swing low to the $117,291 high.
However, the bulls were active near $115,000 and the 61.8% Fib retracement level of the recent move from the $114,157 swing low to the $117,291 high. Bitcoin is now trading above $116,200 and the 100 hourly Simple moving average. Besides, there is a key bullish trend line forming with support at $115,500 on the hourly chart of the BTC/USD pair.
Immediate resistance on the upside is near the $116,950 level. The first key resistance is near the $117,250 level. The next resistance could be $117,800. A close above the $117,800 resistance might send the price further higher. In the stated case, the price could rise and test the $118,500 resistance level. Any more gains might send the price toward the $118,800 level. The next barrier for the bulls could be $119,250.
If Bitcoin fails to rise above the $117,250 resistance zone, it could start a fresh decline. Immediate support is near the $116,200 level. The first major support is near the $115,500 level or the trend line.
The next support is now near the $115,000 zone. Any more losses might send the price toward the $114,500 support in the near term. The main support sits at $112,500, below which BTC might decline heavily.
Technical indicators:
Hourly MACD – The MACD is now gaining pace in the bullish zone.
Hourly RSI (Relative Strength Index) – The RSI for BTC/USD is now above the 50 level.
Major Support Levels – $115,500, followed by $115,000.
Major Resistance Levels – $116,950 and $117,250.
[#item_full_content]NewsBTCRead MoreStrategy says it can withstand a bitcoin price drop to $8,000 and still cover its…
Bitcoin is sitting at a “critical point,” with traders split between two familiar scripts: a…
According to Strategy founder Michael Saylor, the company believes it could meet its obligations even…
Traders are bracing for a heavy week of macroeconomic events, including Fed minutes and the…
Bitcoin price failed to stay above $70,000 and started another decline. BTC is now trading…
The Bitcoin price remains in a fragile phase in its broader market structure, alternating between…