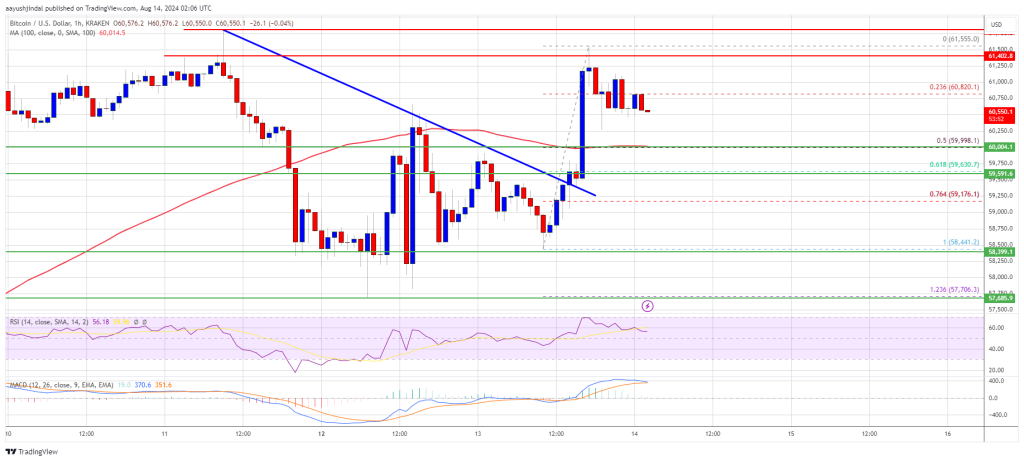
Bitcoin price recovered above the $60,000 resistance zone. BTC is now struggling to clear the $61,200 and $61,500 resistance levels.
Bitcoin started a recovery wave above the $60,000 resistance zone.
The price is trading above $60,000 and the 100 hourly Simple moving average.
There was a break above a connecting bearish trend line with resistance at $59,500 on the hourly chart of the BTC/USD pair (data feed from Kraken).
The pair might attempt a fresh increase if it settles above the $61,500 resistance zone.
Bitcoin price started a decent upward move above the $58,500 resistance zone. BTC was able to clear the $59,500 and $60,000 resistance levels.
There was a break above a connecting bearish trend line with resistance at $59,500 on the hourly chart of the BTC/USD pair. It even spiked above the $61,500 level. A high was formed at $61,555 and the price is now correcting gains.
There was a move below the $61,200 and $61,000 levels. The price dipped below the 23.6% Fib retracement level of the upward move from the $58,441 swing low to the $61,555 high.
Bitcoin price is now trading above $60,000 and the 100 hourly Simple moving average. It is also well above the 50% Fib retracement level of the upward move from the $58,441 swing low to the $61,555 high. On the upside, the price could face resistance near the $61,200 level.
The first key resistance is near the $61,500 level. A clear move above the $61,500 resistance might send the price further higher in the coming sessions. The next key resistance could be $62,500.
The next major hurdle sits at $63,500. A close above the $63,500 resistance might spark more upsides. In the stated case, the price could rise and test the $65,000 resistance.
If Bitcoin fails to rise above the $61,500 resistance zone, it could start another decline. Immediate support on the downside is near the $60,000 level and the 100 hourly Simple moving average.
The first major support is $59,650. The next support is now near the $59,150 zone. Any more losses might send the price toward the $58,500 support zone or even $57,200 in the near term.
Technical indicators:
Hourly MACD – The MACD is now losing pace in the bullish zone.
Hourly RSI (Relative Strength Index) – The RSI for BTC/USD is now above the 50 level.
Major Support Levels – $60,000, followed by $59,650.
Major Resistance Levels – $61,200, and $61,500.
[#item_full_content]NewsBTCRead MoreBitcoin price failed to stay above $70,000 and started another decline. BTC is now trading…
The Bitcoin price remains in a fragile phase in its broader market structure, alternating between…
Rampant speculation on crypto derivatives platforms is fueling volatility and risking bitcoin’s image as a…
XRP is outperforming bitcoin and ether following signs of dip buying during recent crash.Read MoreCoinDesk:…
The difference in futures basis between CME and Deribit reflects varying risk appetite across regions.Read…
As the Bitcoin price tumbled in the past few weeks, several investors are increasingly building…