Bitcoin price is correcting gains from the $52,500 resistance. BTC must stay above the $50,500 support to remain in a bullish zone this month.
Bitcoin price is struggling to clear the $52,800 resistance zone.
The price is trading below $52,200 and the 100 hourly Simple moving average.
There was a break below a key bullish trend line with support at $52,200 on the hourly chart of the BTC/USD pair (data feed from Kraken).
The pair could start a fresh increase unless there is a clear move below the $50,500 support.
Bitcoin price made another attempt to gain strength above the $52,000 resistance zone. BTC broke the $52,200 level, but the bears were still active near the $52,500 level.
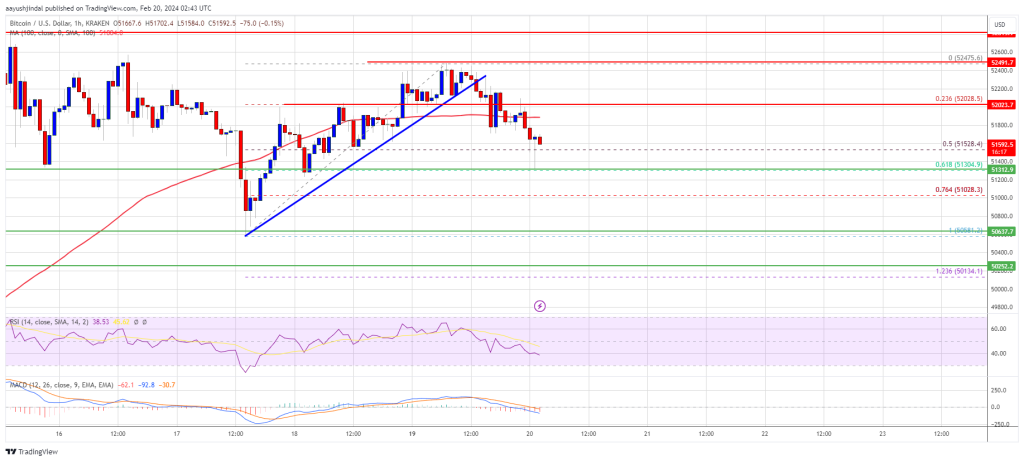
A high was formed near $52,475 and the price is now correcting gains. There was a move below the $52,000 level. The pair traded below the 50% Fib retracement level of the upward move from the $50,581 swing low to the $52,475 high.
Besides, there was a break below a key bullish trend line with support at $52,200 on the hourly chart of the BTC/USD pair. Bitcoin is now trading below $52,000 and the 100 hourly Simple moving average.
Source: BTCUSD on TradingView.com
Immediate resistance is near the $52,000 level. The next key resistance could be $52,200, above which the price could rise toward the $52,500 resistance zone. The main resistance is still near the $52,800 level. A clear move above the $52,800 resistance could send the price toward the $53,500 resistance. The next resistance could be near the $55,000 level.
If Bitcoin fails to rise above the $52,200 resistance zone, it could start another decline in the near term. Immediate support on the downside is near the $51,300 level and the 61.8% Fib retracement level of the upward move from the $50,581 swing low to the $52,475 high.
The first major support is $51,000. If there is a close below $51,000, the price could gain bearish momentum. In the stated case, the price could decline toward the $50,500 support zone, below which the price might turn bearish in the short term.
Technical indicators:
Hourly MACD – The MACD is now gaining pace in the bearish zone.
Hourly RSI (Relative Strength Index) – The RSI for BTC/USD is now below the 50 level.
Major Support Levels – $51,300, followed by $50,500.
Major Resistance Levels – $52,200, $52,500, and $52,800.
[#item_full_content]NewsBTCRead MoreAccording to on-chain analyst Willy Woo, a long-running rise in Bitcoin’s value versus gold has…
Strategy says it can withstand a bitcoin price drop to $8,000 and still cover its…
Bitcoin is sitting at a “critical point,” with traders split between two familiar scripts: a…
According to Strategy founder Michael Saylor, the company believes it could meet its obligations even…
Traders are bracing for a heavy week of macroeconomic events, including Fed minutes and the…
Bitcoin price failed to stay above $70,000 and started another decline. BTC is now trading…