XRP price extended losses and traded below $1.20. The price is now consolidating losses and faces hurdles near $1.1920 and $1.1950.
XRP price started another decline and traded below the $1.20 zone.
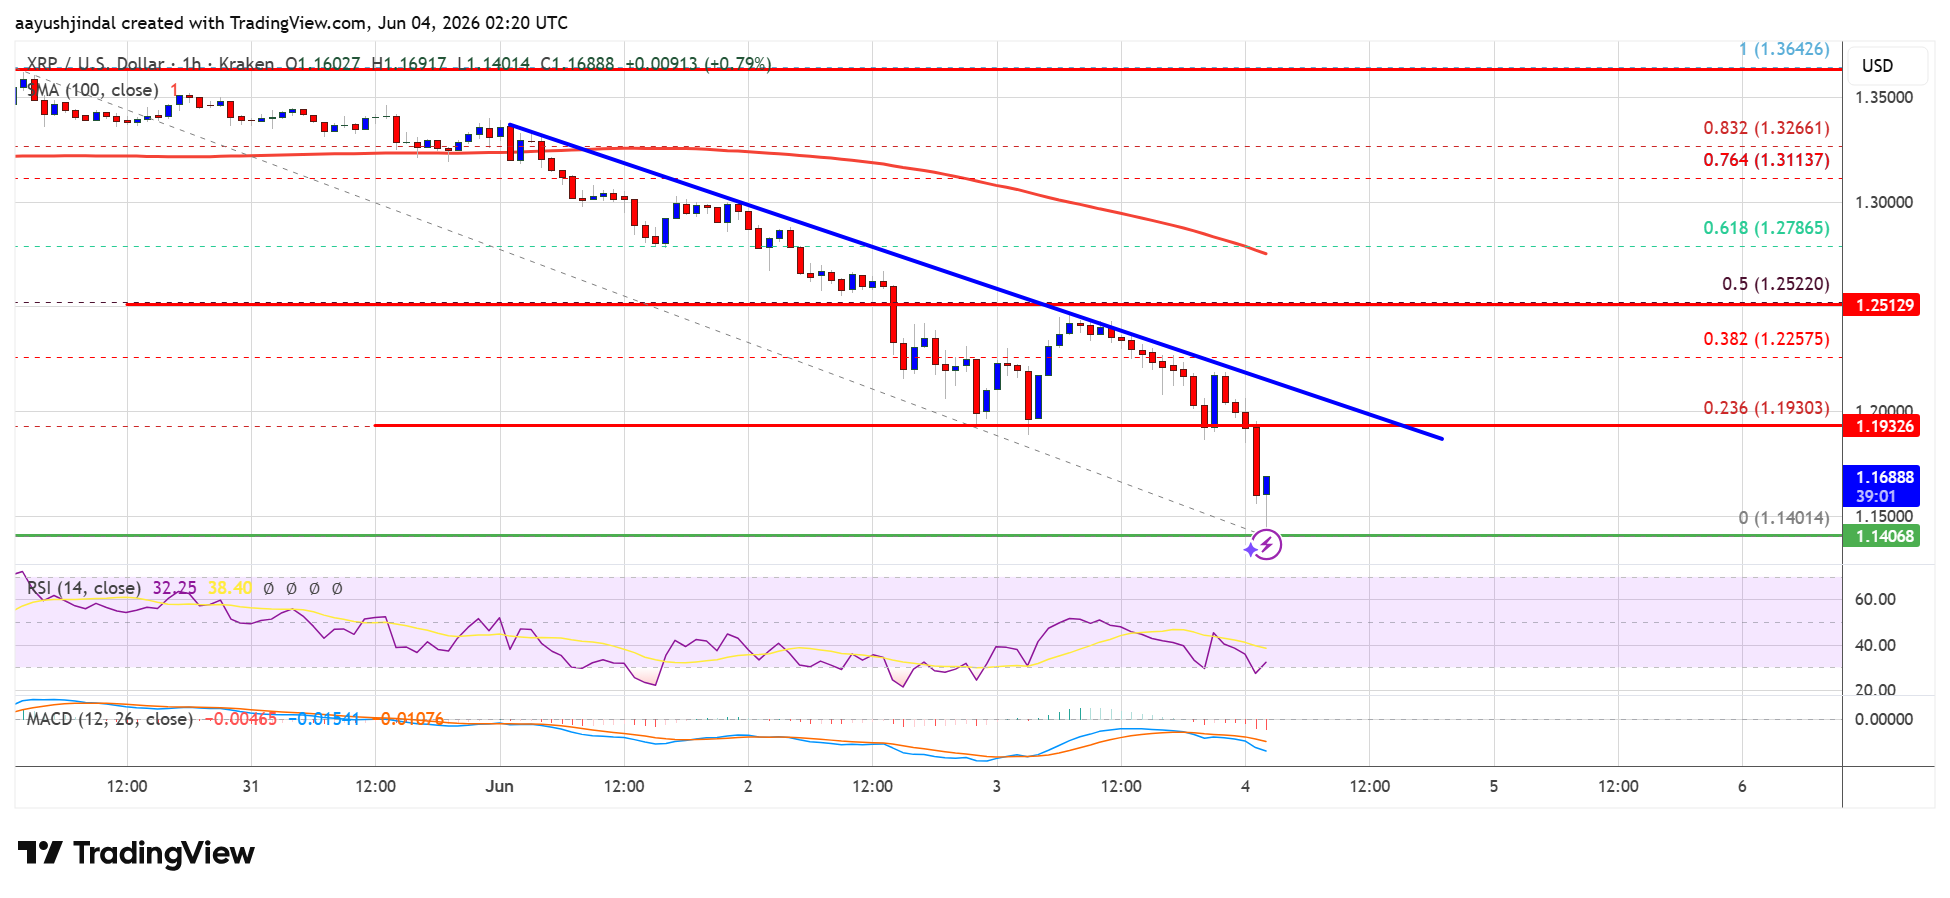
The price is now trading below $1.20 and the 100-hourly Simple Moving Average.
There is a bearish trend line forming with resistance at $1.1950 on the hourly chart of the XRP/USD pair (data source from Kraken).
The pair could continue to move down if it stays below $1.20.
XRP price failed to stay above $1.20 and extended its decline, like Bitcoin and Ethereum. The price declined below $1.1950 and $1.1920 to enter a short-term bearish zone.
The price even extended losses below $1.180. A low was formed at $1.1401, and the price is now consolidating losses well below the 23.6% Fib retracement level of the downward move from the $1.3640 swing high to the $1.1401 low.
The price is now trading below $1.1920 and the 100-hourly Simple Moving Average. If there is a fresh recovery move, the price might face resistance near the $1.1880 level. The first major resistance is near the $1.1920 level. The main resistance could be $1.1950. There is also a bearish trend line forming with resistance at $1.1950 on the hourly chart of the XRP/USD pair.
A close above $1.1950 could send the price to $1.20. The next hurdle sits at $1.220. A clear move above the $1.220 resistance might send the price toward the $1.250 resistance or the 50% Fib retracement level of the downward move from the $1.3640 swing high to the $1.1401 low. Any more gains might send the price toward the $1.2850 resistance.
If XRP fails to clear the $1.1950 resistance zone, it could start a fresh decline. Initial support on the downside is near the $1.160 level. The next major support is near the $1.1550 level.
If there is a downside break and a close below the $1.1550 level, the price might continue to decline toward $1.150. The next major support sits near the $1.1440 zone, below which the price could continue lower toward $1.140.
Technical Indicators
Hourly MACD – The MACD for XRP/USD is now gaining pace in the bearish zone.
Hourly RSI (Relative Strength Index) – The RSI for XRP/USD is now below the 50 level.
Major Support Levels – $1.1600 and $1.1550.
Major Resistance Levels – $1.1950 and $1.2000.
[#item_full_content]NewsBTCRead MoreBitcoin Magazine Satsuma Shareholders Approve Bitcoin Liquidation, London Delisting Satsuma shareholders have voted to unwind…
Your day-ahead look for July 22, 2026Read MoreCoinDesk: Bitcoin, Ethereum, Crypto News and Price Data[#item_full_content]
BTC retreated from a one-month high as WTI crude topped $85 for the first time…
An attacker fed the lending system a fake, abnormally low bitcoin price, liquidated vaults that…
A two-day chip rebound stalled ahead of Alphabet's earnings in a sign of whether the…
Semiconductor stocks led a second day of gains on AI optimism, while the yen slid…