Ripple started a strong increase above the $0.350 resistance against the US Dollar. XRP price is now attempting a key upside break above the $0.380 resistance.
Ripple started a fresh increase from the key $0.320 support zone against the US dollar.
The price is now trading below $0.400 and the 100 simple moving average (4-hours).
There is a major bearish trend line forming with resistance near $0.380 on the 4-hours chart of the XRP/USD pair (data source from Kraken).
The pair could start a strong increase if it clears the $0.38 resistance zone.
After a sharp decline, ripple’s XRP found support near $0.320 against the US Dollar. The bears made two attempts to push the price below the $0.32 support, but they failed.
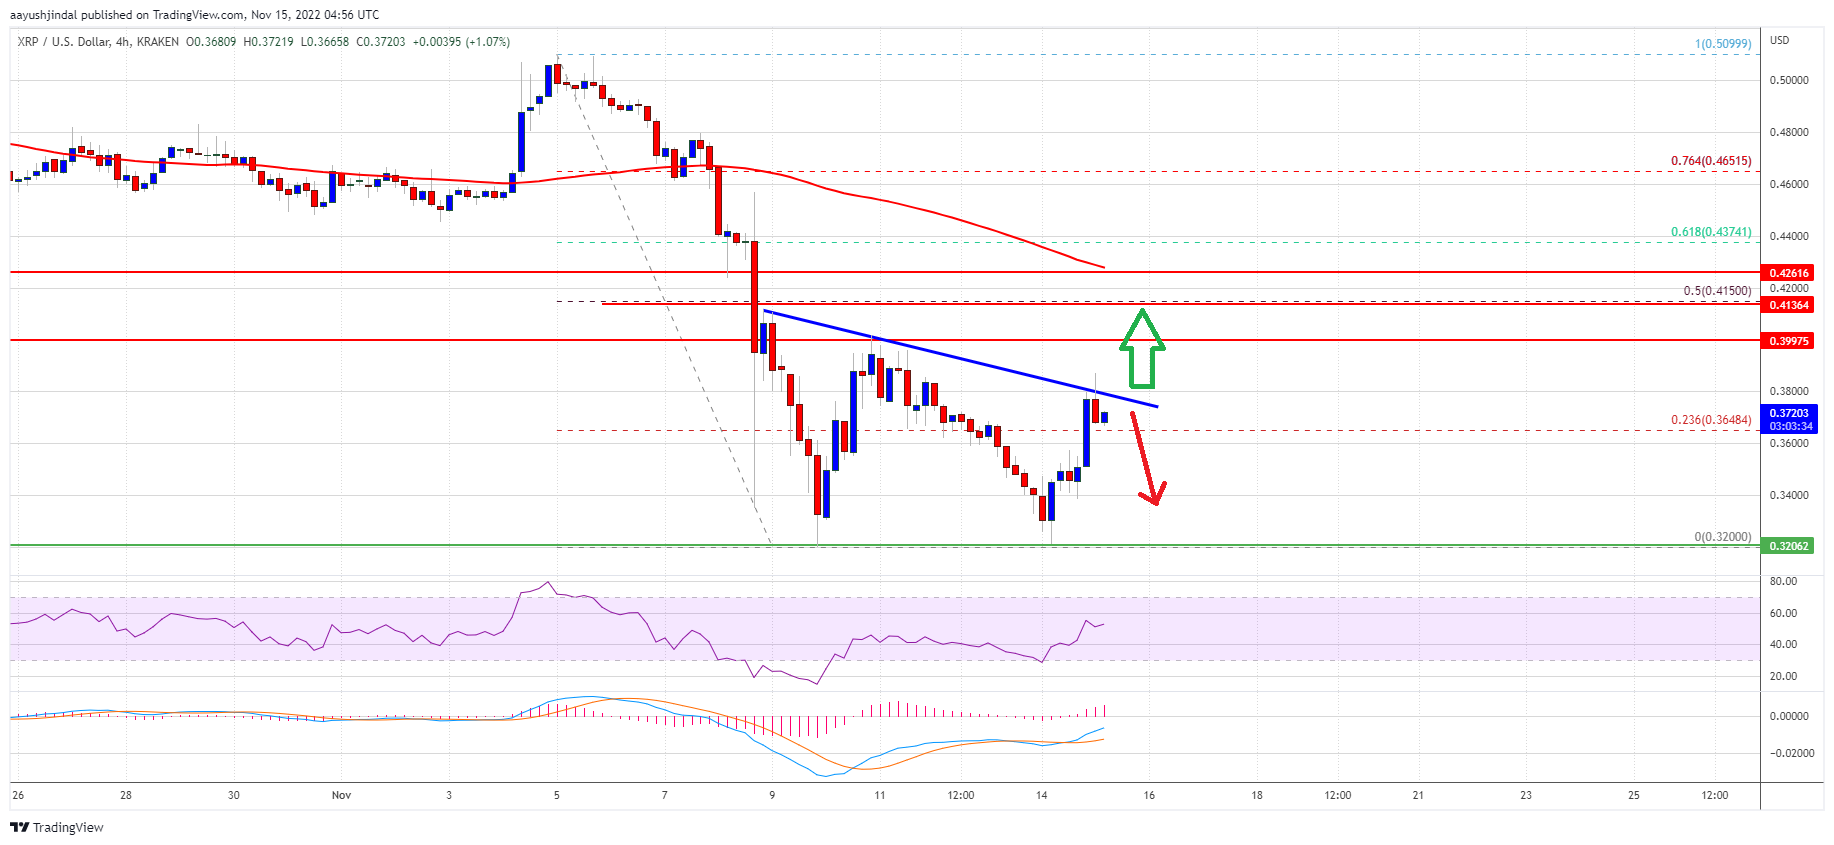
The recent low was formed near $0.32 before there was a fresh increase. XRP price climbed over 15% and cleared the $0.35 resistance, outperforming bitcoin and ethereum. The price climbed above the 23.6% Fib retracement level of the downward move from the $0.5099 swing high to $0.3200 swing low.
The price gained pace for a move above the $0.360 resistance. However, it is now trading below $0.400 and the 100 simple moving average (4-hours). It is now facing hurdles near $0.380. There is also a major bearish trend line forming with resistance near $0.380 on the 4-hours chart of the XRP/USD pair.
Source: XRPUSD on TradingView.com
A successful break above the $0.380 and $0.385 resistance levels could spark another rally. The next key resistance is near the $0.415 level. It is near the 50% Fib retracement level of the downward move from the $0.5099 swing high to $0.3200 swing low. Any more gains might send the price towards the $0.44 level.
If ripple fails to clear the $0.380 resistance zone, it could start a downside correction. An initial support on the downside is near the $0.365 level.
The next major support is near $0.342. If there is a downside break and close below the $0.342 level, xrp price could extend losses. In the stated case, the price could even decline below the $0.320 support.
Technical Indicators
4-Hours MACD – The MACD for XRP/USD is now gaining pace in the bullish zone.
4-Hours RSI (Relative Strength Index) – The RSI for XRP/USD is now above the 50 level.
Major Support Levels – $0.365, $0.342 and $0.320.
Major Resistance Levels – $0.380, $0.385 and $0.415.
Ripple started a strong increase above the $0.350 resistance against the US Dollar. XRP price is now attempting a key upside break above the $0.380 resistance.
Ripple started a fresh increase from the key $0.320 support zone against the US dollar.
The price is now trading below $0.400 and the 100 simple moving average (4-hours).
There is a major bearish trend line forming with resistance near $0.380 on the 4-hours chart of the XRP/USD pair (data source from Kraken).
The pair could start a strong increase if it clears the $0.38 resistance zone.
After a sharp decline, ripple’s XRP found support near $0.320 against the US Dollar. The bears made two attempts to push the price below the $0.32 support, but they failed.
The recent low was formed near $0.32 before there was a fresh increase. XRP price climbed over 15% and cleared the $0.35 resistance, outperforming bitcoin and ethereum. The price climbed above the 23.6% Fib retracement level of the downward move from the $0.5099 swing high to $0.3200 swing low.
The price gained pace for a move above the $0.360 resistance. However, it is now trading below $0.400 and the 100 simple moving average (4-hours). It is now facing hurdles near $0.380. There is also a major bearish trend line forming with resistance near $0.380 on the 4-hours chart of the XRP/USD pair.
Source: XRPUSD on TradingView.com
A successful break above the $0.380 and $0.385 resistance levels could spark another rally. The next key resistance is near the $0.415 level. It is near the 50% Fib retracement level of the downward move from the $0.5099 swing high to $0.3200 swing low. Any more gains might send the price towards the $0.44 level.
If ripple fails to clear the $0.380 resistance zone, it could start a downside correction. An initial support on the downside is near the $0.365 level.
The next major support is near $0.342. If there is a downside break and close below the $0.342 level, xrp price could extend losses. In the stated case, the price could even decline below the $0.320 support.
Technical Indicators
4-Hours MACD – The MACD for XRP/USD is now gaining pace in the bullish zone.
4-Hours RSI (Relative Strength Index) – The RSI for XRP/USD is now above the 50 level.
Major Support Levels – $0.365, $0.342 and $0.320.
Major Resistance Levels – $0.380, $0.385 and $0.415.
Tags: RipplexrpXRPBTCXRPUSDxrpusdcxrpusdt
NewsBTCRead More
Bitcoin (BTC) is currently holding below the key $70,000 level. Still, a new report from…
Reports say a popular risk metric has fallen into territory that, in the past, lined…
On-chain data shows the key Bitcoin investors have been distributing recently, with their supply share…
Crypto prices edged higher on Friday despite a splash of tariff turbulence after the U.S.…
The industry’s largest cryptocurrencies, Bitcoin (BTC) and Ethereum (ETH), are enduring one of their most…
Bitcoin Magazine Nakamoto Inc. ($NAKA) Completes Acquisition of BTC Inc. and UTXO Management Nakamoto Inc.…