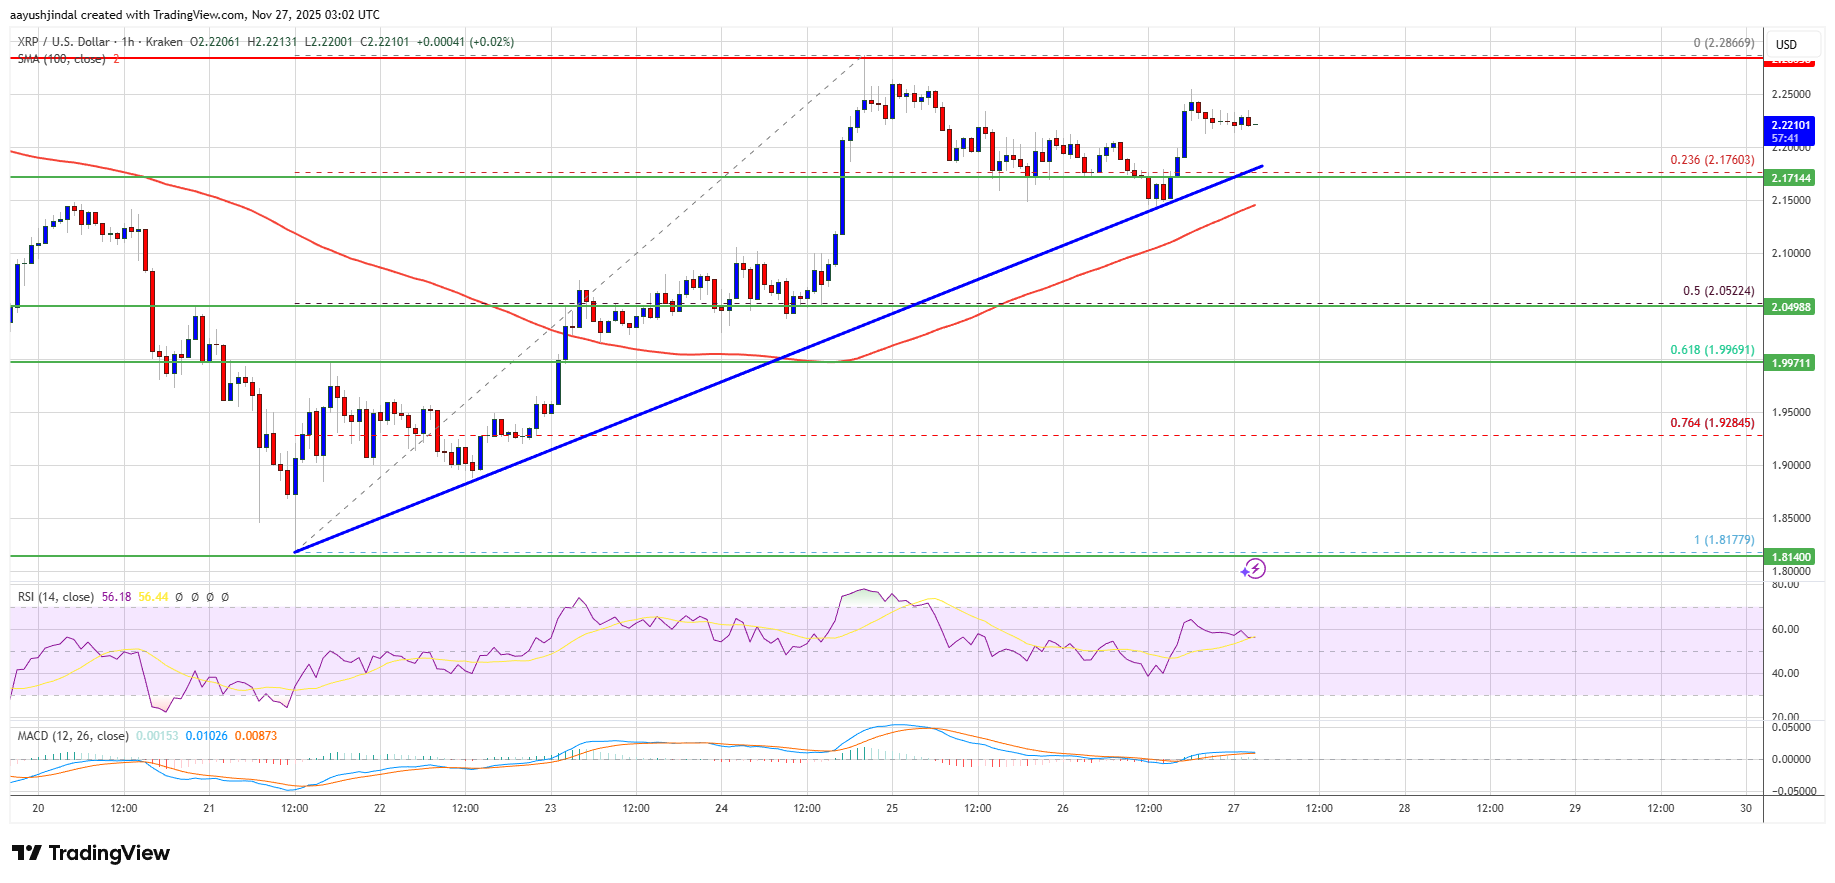
XRP price started a steady increase above $2.20. The price is now consolidating gains and might aim for another increase if it clears $2.280.
XRP price started a fresh increase above the $2.220 zone.
The price is now trading above $2.20 and the 100-hourly Simple Moving Average.
There is a bullish trend line forming with support at $2.180 on the hourly chart of the XRP/USD pair (data source from Kraken).
The pair could continue to move up if it clears $2.280.
XRP price started a decent upward move above $2.10 and $2.120, beating Bitcoin and Ethereum. The price gained pace for a clear move above the $2.20 resistance.
The bulls even pumped the price above the $2.220 zone. A high was formed at $2.286 and the price started a short-term downside correction, but ETH and BTC rallied. There was a move below the 23.6% Fib retracement level of the upward move from the $1.817 swing low to the $2.286 high.
The price is now trading above $2.20 and the 100-hourly Simple Moving Average. Besides, there is a bullish trend line forming with support at $2.180 on the hourly chart of the XRP/USD pair.
If there is a fresh upward move, the price might face resistance near the $2.2650 level. The first major resistance is near the $2.280 level, above which the price could rise and test $2.350. A clear move above the $2.350 resistance might send the price toward the $2.450 resistance. Any more gains might send the price toward the $2.50 resistance. The next major hurdle for the bulls might be near $2.550.
If XRP fails to clear the $2.280 resistance zone, it could start a fresh decline. Initial support on the downside is near the $2.180 level and the trend line. The next major support is near the $2.120 level.
If there is a downside break and a close below the $2.120 level, the price might continue to decline toward $2.050 and the 50% Fib retracement level of the upward move from the $1.817 swing low to the $2.286 high. The next major support sits near the $2.00 zone, below which the price could continue lower toward $1.9250.
Technical Indicators
Hourly MACD – The MACD for XRP/USD is now losing pace in the bullish zone.
Hourly RSI (Relative Strength Index) – The RSI for XRP/USD is now above the 50 level.
Major Support Levels – $2.180 and $2.050.
Major Resistance Levels – $2.280 and $2.350.
[#item_full_content]NewsBTCRead MoreBitcoin Magazine Is Bitcoin Out of Its Bear Market? These Analysts Think So Bitcoin is…
Bitcoin Magazine Bitcoin Breakout Could Be Around the Corner as Asset Is No Longer Oversold:…
Bitcoin Magazine Bitcoin Tops $81,000 — Is the Debasement Trade Back? Bitcoin soared past $81,000…
Bitcoin crossed $80,000 for the first time since May, extending its seven-day advance to roughly…
Falling open interest and subdued funding rates suggest the rally remains structurally healthy.Read MoreCoinDesk: Bitcoin,…
Your day-ahead look for Aug. 25, 2026Read MoreCoinDesk: Bitcoin, Ethereum, Crypto News and Price Data[#item_full_content]