Ripple failed to clear $0.40 and corrected lower against the US Dollar. XRP price could start a decent increase if it stays above the $0.345 support zone.
Ripple started a fresh decline from the $0.40 resistance zone against the US dollar.
The price is now trading below $0.380 and the 100 simple moving average (4-hours).
There is a key bearish trend line forming with resistance near $0.371 on the 4-hours chart of the XRP/USD pair (data source from Kraken).
The pair could start a strong increase if it clears the $0.388 resistance zone.
This past week, ripple’s XRP attempted an upside break above the $0.40 resistance against the US Dollar. However, the bears remained active near $0.40 and pushed the price lower.
However, the recent decline was limited when compared to bitcoin and ethereum. The price declined below the $0.372 and $0.365 support levels. It traded as low as $0.3458 and is currently consolidating losses. It is trading below $0.380 and the 100 simple moving average (4-hours).
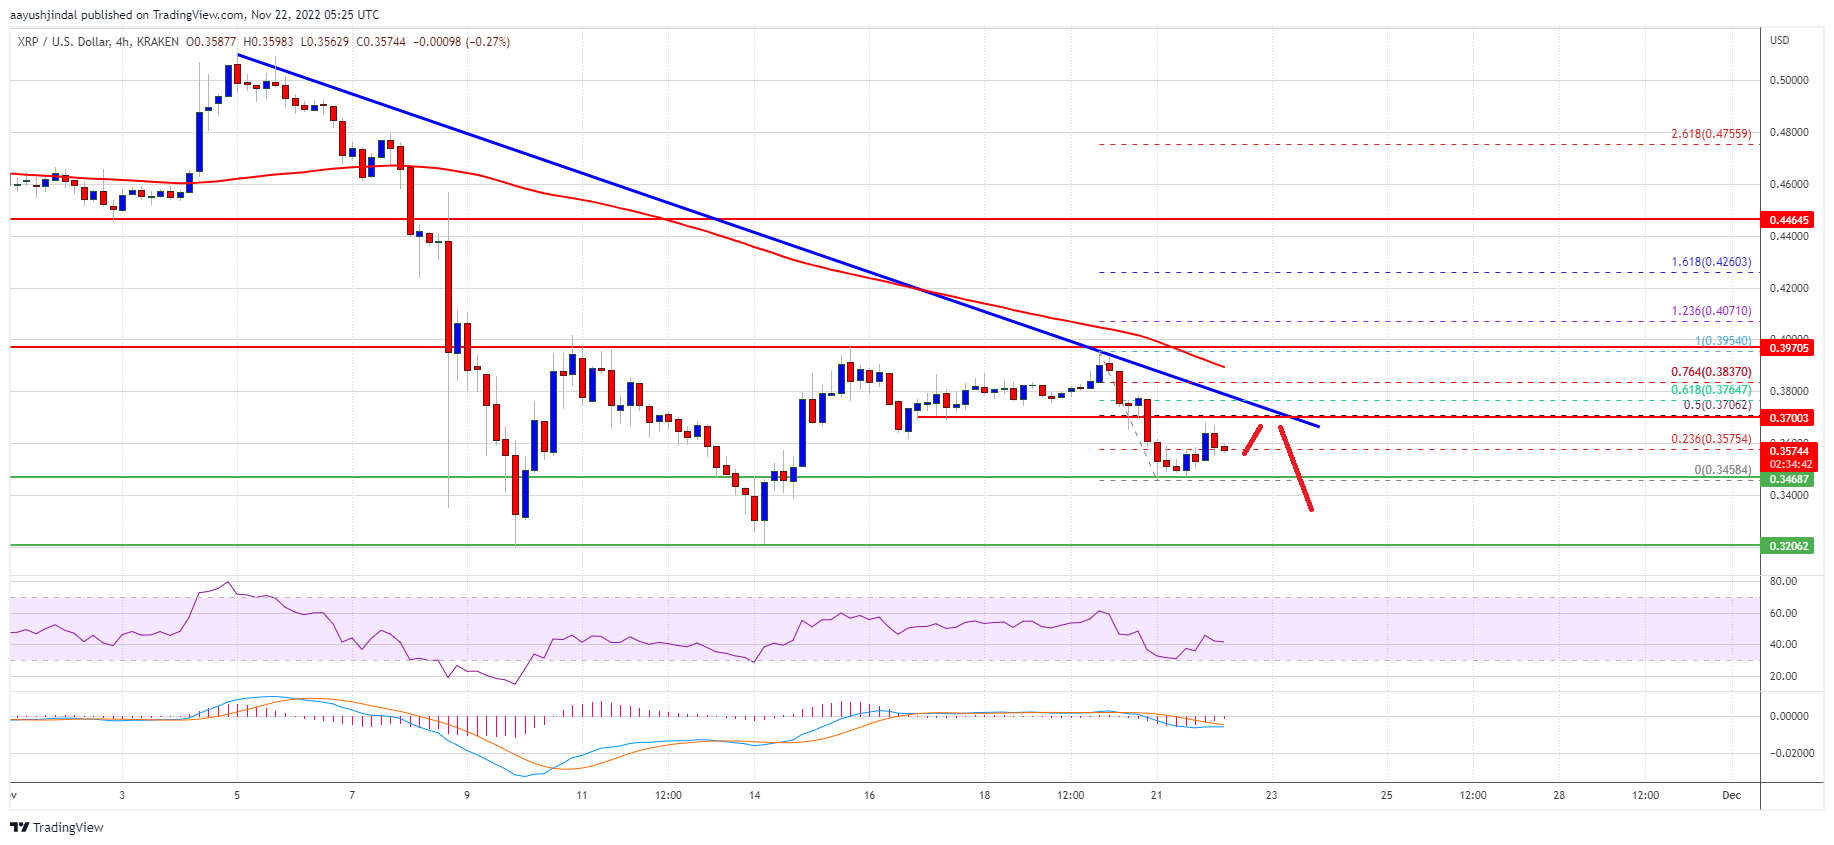
XRP price is now facing hurdles near $0.370. It is close to the 50% Fib retracement level of the downward move from the $0.3954 swing high to $0.3458 swing low.
There is also a key bearish trend line forming with resistance near $0.371 on the 4-hours chart of the XRP/USD pair. A successful break above the trend line resistance might send the price towards the $0.380 resistance or the 76.4% Fib retracement level of the downward move from the $0.3954 swing high to $0.3458 swing low.
Source: XRPUSD on TradingView.com
The next key resistance is near the $0.388 level. The main barrier is still near the $0.40 level. Any more gains might send the price towards the $0.45 level.
If ripple fails to clear the $0.388 resistance zone, it could slowly move down. An initial support on the downside is near the $0.345 level.
The next major support is near $0.332. If there is a downside break and close below the $0.332 level, xrp price could extend losses. In the stated case, the price could even decline below the $0.320 support.
Technical Indicators
4-Hours MACD – The MACD for XRP/USD is now losing pace in the bearish zone.
4-Hours RSI (Relative Strength Index) – The RSI for XRP/USD is now below the 50 level.
Major Support Levels – $0.345, $0.332 and $0.320.
Major Resistance Levels – $0.371, $0.388 and $0.400.
Ripple failed to clear $0.40 and corrected lower against the US Dollar. XRP price could start a decent increase if it stays above the $0.345 support zone.
Ripple started a fresh decline from the $0.40 resistance zone against the US dollar.
The price is now trading below $0.380 and the 100 simple moving average (4-hours).
There is a key bearish trend line forming with resistance near $0.371 on the 4-hours chart of the XRP/USD pair (data source from Kraken).
The pair could start a strong increase if it clears the $0.388 resistance zone.
This past week, ripple’s XRP attempted an upside break above the $0.40 resistance against the US Dollar. However, the bears remained active near $0.40 and pushed the price lower.
However, the recent decline was limited when compared to bitcoin and ethereum. The price declined below the $0.372 and $0.365 support levels. It traded as low as $0.3458 and is currently consolidating losses. It is trading below $0.380 and the 100 simple moving average (4-hours).
XRP price is now facing hurdles near $0.370. It is close to the 50% Fib retracement level of the downward move from the $0.3954 swing high to $0.3458 swing low.
There is also a key bearish trend line forming with resistance near $0.371 on the 4-hours chart of the XRP/USD pair. A successful break above the trend line resistance might send the price towards the $0.380 resistance or the 76.4% Fib retracement level of the downward move from the $0.3954 swing high to $0.3458 swing low.
Source: XRPUSD on TradingView.com
The next key resistance is near the $0.388 level. The main barrier is still near the $0.40 level. Any more gains might send the price towards the $0.45 level.
If ripple fails to clear the $0.388 resistance zone, it could slowly move down. An initial support on the downside is near the $0.345 level.
The next major support is near $0.332. If there is a downside break and close below the $0.332 level, xrp price could extend losses. In the stated case, the price could even decline below the $0.320 support.
Technical Indicators
4-Hours MACD – The MACD for XRP/USD is now losing pace in the bearish zone.
4-Hours RSI (Relative Strength Index) – The RSI for XRP/USD is now below the 50 level.
Major Support Levels – $0.345, $0.332 and $0.320.
Major Resistance Levels – $0.371, $0.388 and $0.400.
Tags: RipplexrpXRPBTCXRPUSDxrpusdcxrpusdt
NewsBTCRead More
Data shows the Bitcoin perpetual futures market has seen a negative Funding Rate recently, suggesting…
Despite the crypto market’s renewed weakness on Thursday, a new AI-driven market model produced by…
The recent price action echoes the November–January pattern, showing weak conviction among the “buy the…
Morgan Stanley has filed to launch a spot Bitcoin ETF with the ticker MSBT and…
Oil prices slipped as major economies announced joint efforts to stabilize energy markets.Read MoreCoinDesk: Bitcoin,…
BTQ Technologies moved a key Bitcoin (BTC) security proposal from theory to practice on Thursday,…