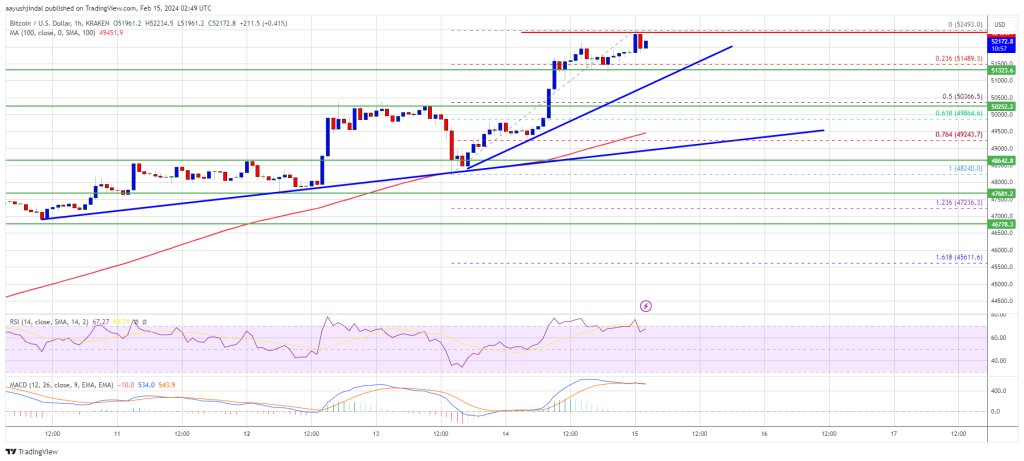
Bitcoin price extended its increase above the $52,000 resistance. BTC is consolidating gains and might aim for more upsides toward the $55,000 resistance.
Bitcoin price remained in a bullish zone above the $51,000 and $51,200 levels.
The price is trading above $51,200 and the 100 hourly Simple moving average.
There are two bullish trend lines forming with support at $51,450 and $49,200 on the hourly chart of the BTC/USD pair (data feed from Kraken).
The pair could continue to move up if it clears the $52,500 resistance zone.
Bitcoin price started a steady increase above the $50,000 resistance zone. BTC gained strength above the $50,500 and $51,200 levels. It even spiked above the $52,000 resistance zone.
A new multi-week high was formed near $52,493 and the price is now consolidating gains. It is holding gains above the 23.6% Fib retracement level of the recent wave from the $48,240 swing low to the $52,493 high. There are also two bullish trend lines forming with support at $51,450 and $49,200 on the hourly chart of the BTC/USD pair.
Bitcoin is now trading above $51,200 and the 100 hourly Simple moving average. Immediate resistance is near the $52,500 level. The next key resistance could be $53,200, above which the price could extend its rally.
Source: BTCUSD on TradingView.com
The next stop for the bulls may perhaps be $54,400. A clear move above the $54,400 resistance could send the price toward the $55,000 resistance. The next resistance could be near the $56,500 level.
If Bitcoin fails to rise above the $52,500 resistance zone, it could start another downside correction in the near term. Immediate support on the downside is near the $51,500 level and the first trend line.
The first major support is $50,500 and the 50% Fib retracement level of the recent wave from the $48,240 swing low to the $52,493 high. If there is a close below $50,500, the price could gain bearish momentum. In the stated case, the price could dive toward the $49,200 support and the second trend line.
Technical indicators:
Hourly MACD – The MACD is now gaining pace in the bullish zone.
Hourly RSI (Relative Strength Index) – The RSI for BTC/USD is now above the 50 level.
Major Support Levels – $51,500, followed by $50,500.
Major Resistance Levels – $52,500, $53,200, and $54,400.
[#item_full_content]NewsBTCRead MoreBitcoin trades in a tight range as derivatives stabilize and altcoins show pockets of strength…
Bitcoin remains stuck below the $70,000 mark, a level that once served as a crucial…
Crypto majors soften while Asian equities rebound modestly, with traders continuing to weigh quantum fears,…
Bitcoin continues to struggle to reclaim the $70,000 level, with persistent selling pressure keeping the…
Bitcoin spot ETFs in the United States still hold about $85 billion in assets, despite…
On-chain analytics firm Glassnode has highlighted how accumulation during the recent Bitcoin drop has looked…