Tron price is up over 5% and showing positive signs above $0.055 against the US Dollar. TRX could outperform bitcoin and rise further towards $0.060.
Tron price is trading in a positive zone well above the $0.0520 pivot level against the US dollar.
The price is showing positive signs above $0.055 and the 100 simple moving average (4-hours).
There is a major bullish trend line forming with support near $0.0530 on the 4-hours chart of the TRX/USD pair (data source from Kraken).
The pair is likely to start a fresh increase above the $0.0562 and $0.0575 resistance levels.
In the past few days, tron price remained strong above the $0.0520 level against the US Dollar, outperforming bitcoin and ethereum. TRX gained pace for a clear move above the $0.055 resistance and the 100 simple moving average (4-hours).
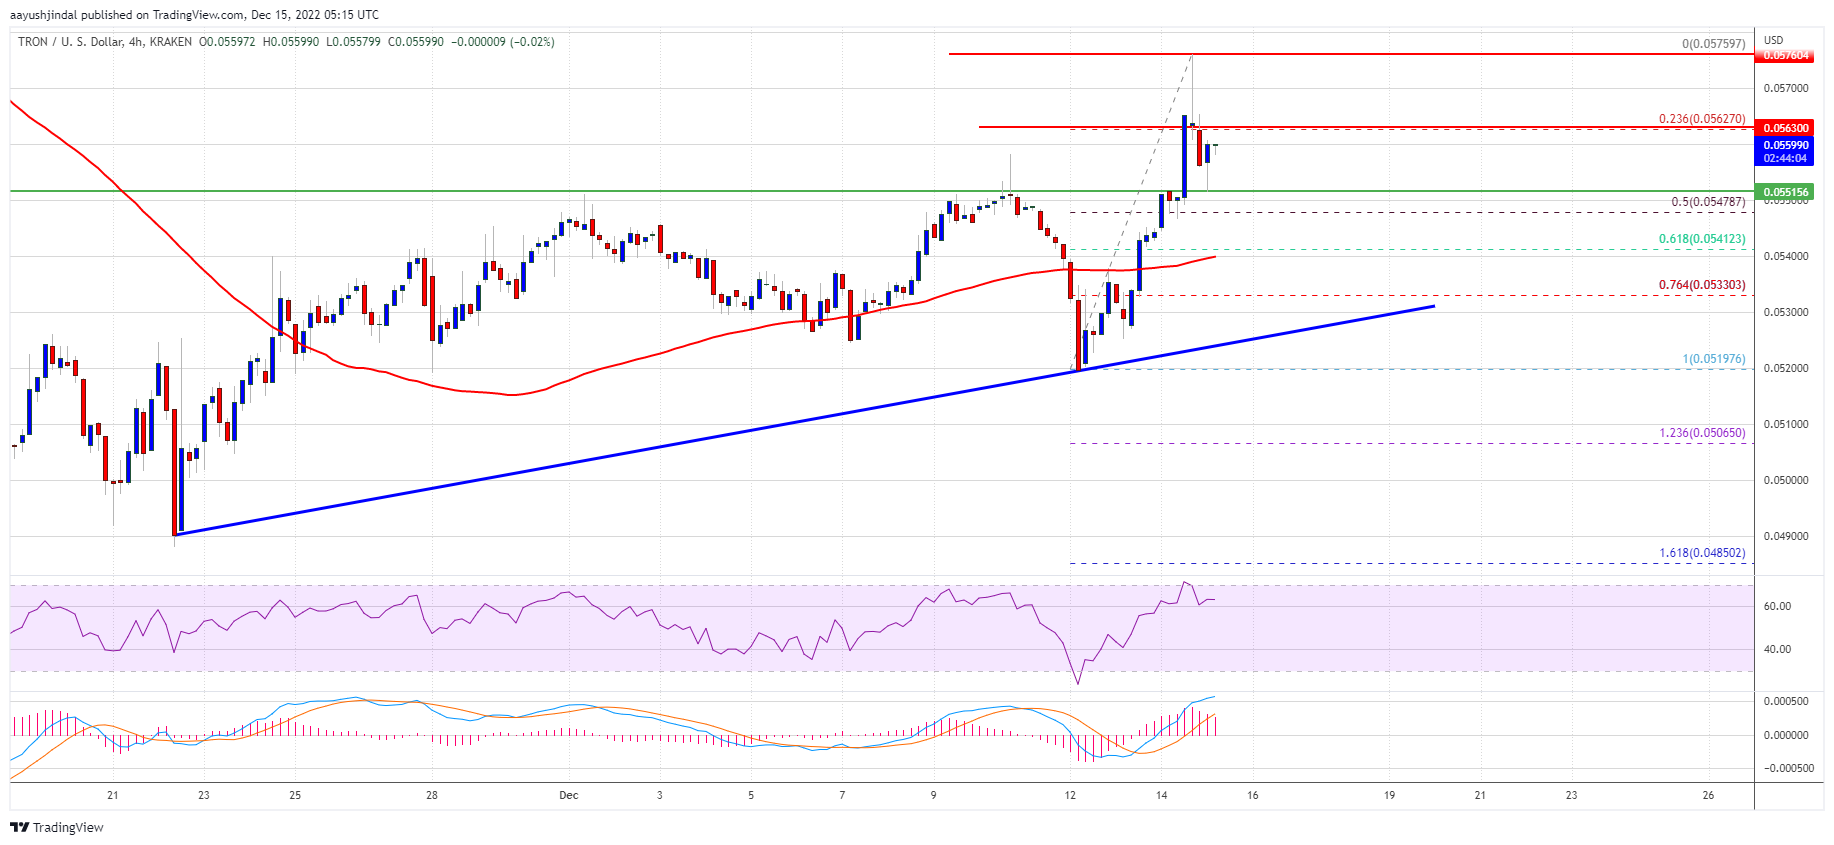
The price traded to a new weekly high at $0.0575 and it is currently correcting gains. There was a move below the 23.6% Fib retracement level of the recent rally from the $0.0519 low to $0.0575 high. Trx price is now trading above $0.055 and the 100 simple moving average (4-hours).
It is also above the 50% Fib retracement level of the recent rally from the $0.0519 low to $0.0575 high. On the upside, an initial resistance is near the $0.0562 level.
Source: TRXUSD on TradingView.com
The next major resistance is near the $0.0575 level, above which the bulls are likely to aim a larger increase towards the key $0.0600 zone in the coming sessions. Any more gains could set the pace for a move towards the $0.0645 level.
If TRX price fails to clear the $0.0575 barrier, it could correct lower. An initial support on the downside is near the $0.0550 zone, where the bulls are currently taking a stand.
The next major support is near the $0.0540 level and the 100 simple moving average (4-hours). The main support is near the trend line and $0.0530, below which there is a risk of a move towards the $0.050 support.
Technical Indicators
4-hours MACD – The MACD for TRX/USD is gaining momentum in the bullish zone.
4-hours RSI (Relative Strength Index) – The RSI for TRX/USD is currently above the 50 level.
Major Support Levels – $0.0550, $0.0542 and $0.0530.
Major Resistance Levels – $0.0562, $0.0575 and $0.0600.
Tron price is up over 5% and showing positive signs above $0.055 against the US Dollar. TRX could outperform bitcoin and rise further towards $0.060.
Tron price is trading in a positive zone well above the $0.0520 pivot level against the US dollar.
The price is showing positive signs above $0.055 and the 100 simple moving average (4-hours).
There is a major bullish trend line forming with support near $0.0530 on the 4-hours chart of the TRX/USD pair (data source from Kraken).
The pair is likely to start a fresh increase above the $0.0562 and $0.0575 resistance levels.
In the past few days, tron price remained strong above the $0.0520 level against the US Dollar, outperforming bitcoin and ethereum. TRX gained pace for a clear move above the $0.055 resistance and the 100 simple moving average (4-hours).
The price traded to a new weekly high at $0.0575 and it is currently correcting gains. There was a move below the 23.6% Fib retracement level of the recent rally from the $0.0519 low to $0.0575 high. Trx price is now trading above $0.055 and the 100 simple moving average (4-hours).
It is also above the 50% Fib retracement level of the recent rally from the $0.0519 low to $0.0575 high. On the upside, an initial resistance is near the $0.0562 level.
Source: TRXUSD on TradingView.com
The next major resistance is near the $0.0575 level, above which the bulls are likely to aim a larger increase towards the key $0.0600 zone in the coming sessions. Any more gains could set the pace for a move towards the $0.0645 level.
If TRX price fails to clear the $0.0575 barrier, it could correct lower. An initial support on the downside is near the $0.0550 zone, where the bulls are currently taking a stand.
The next major support is near the $0.0540 level and the 100 simple moving average (4-hours). The main support is near the trend line and $0.0530, below which there is a risk of a move towards the $0.050 support.
Technical Indicators
4-hours MACD – The MACD for TRX/USD is gaining momentum in the bullish zone.
4-hours RSI (Relative Strength Index) – The RSI for TRX/USD is currently above the 50 level.
Major Support Levels – $0.0550, $0.0542 and $0.0530.
Major Resistance Levels – $0.0562, $0.0575 and $0.0600.
Tags: TRONtron pricetrxusdTRXUSDT
NewsBTCRead More
For readers tracking where the market is actually changing, this is the part that matters.…
The headline number is useful, but the real story is what it says about positioning.…
Bitcoin Magazine Bitcoin Exchange Inflows Spike to 49,000 BTC in a Day, Signaling More Volatility…
Bitcoin Magazine Wavespace Launches MiCA-Compliant Self-Custodial Bitcoin Debit Card Powered by Lightning and NWC Wavespace,…
For readers tracking where the market is actually changing, this is the part that matters.…
The headline number is useful, but the real story is what it says about positioning.…