Tron price is up over 5% and showing positive signs above $0.055 against the US Dollar. TRX could outperform bitcoin and rise further towards $0.060.
Tron price is trading in a positive zone well above the $0.0520 pivot level against the US dollar.
The price is showing positive signs above $0.055 and the 100 simple moving average (4-hours).
There is a major bullish trend line forming with support near $0.0530 on the 4-hours chart of the TRX/USD pair (data source from Kraken).
The pair is likely to start a fresh increase above the $0.0562 and $0.0575 resistance levels.
In the past few days, tron price remained strong above the $0.0520 level against the US Dollar, outperforming bitcoin and ethereum. TRX gained pace for a clear move above the $0.055 resistance and the 100 simple moving average (4-hours).
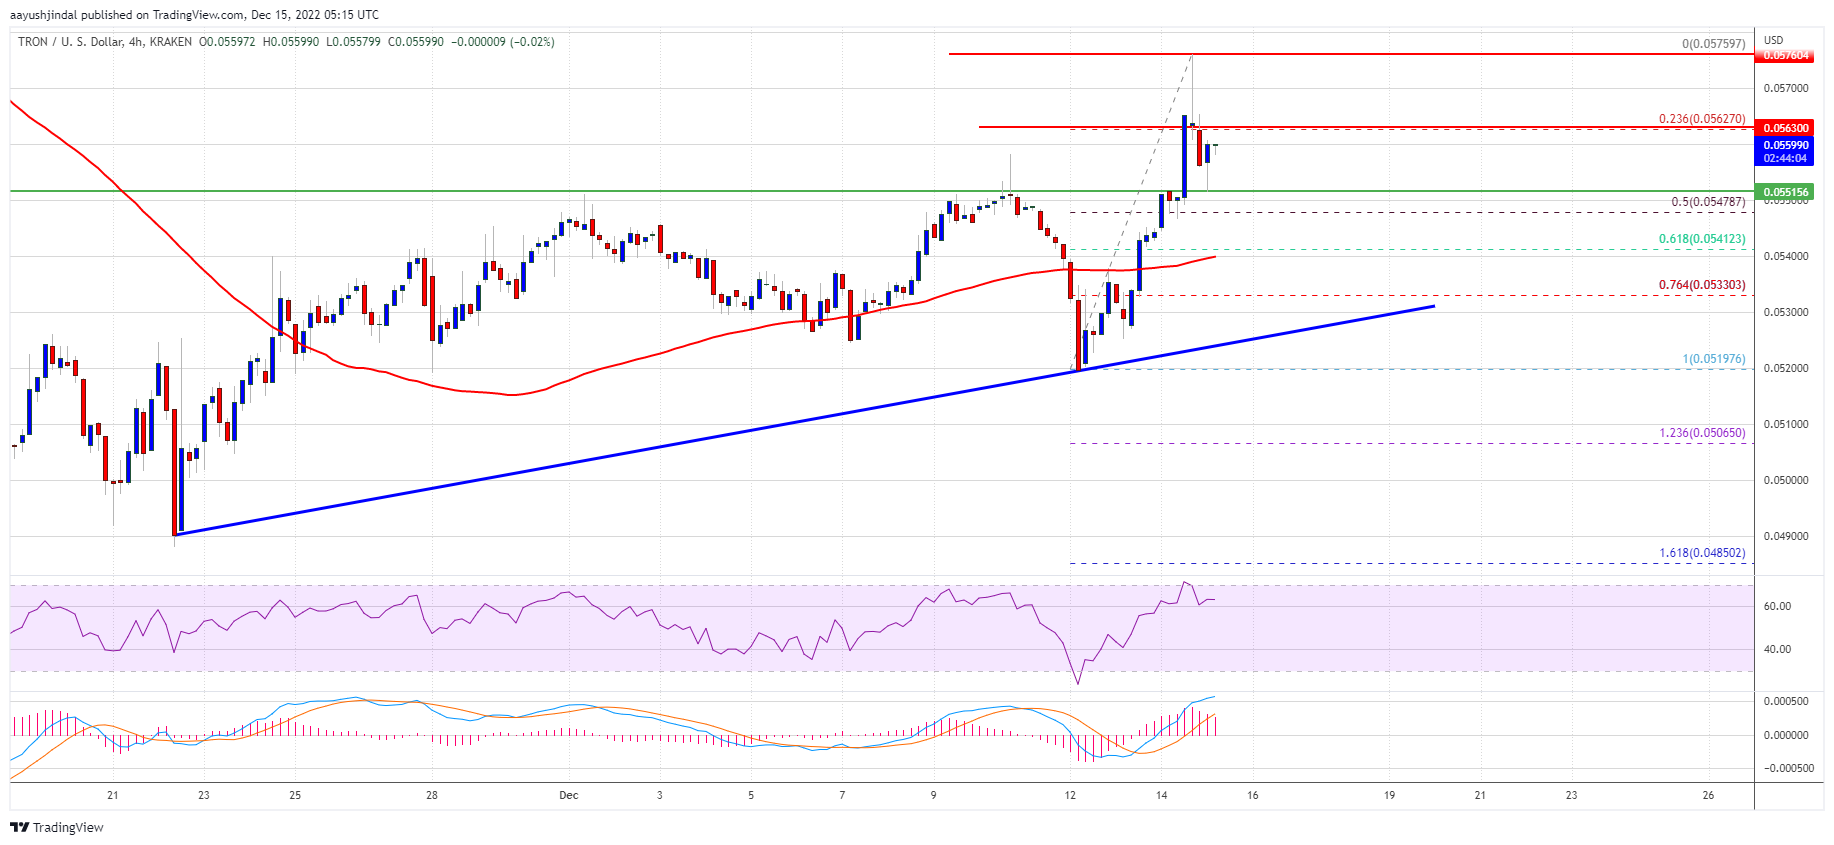
The price traded to a new weekly high at $0.0575 and it is currently correcting gains. There was a move below the 23.6% Fib retracement level of the recent rally from the $0.0519 low to $0.0575 high. Trx price is now trading above $0.055 and the 100 simple moving average (4-hours).
It is also above the 50% Fib retracement level of the recent rally from the $0.0519 low to $0.0575 high. On the upside, an initial resistance is near the $0.0562 level.
Source: TRXUSD on TradingView.com
The next major resistance is near the $0.0575 level, above which the bulls are likely to aim a larger increase towards the key $0.0600 zone in the coming sessions. Any more gains could set the pace for a move towards the $0.0645 level.
If TRX price fails to clear the $0.0575 barrier, it could correct lower. An initial support on the downside is near the $0.0550 zone, where the bulls are currently taking a stand.
The next major support is near the $0.0540 level and the 100 simple moving average (4-hours). The main support is near the trend line and $0.0530, below which there is a risk of a move towards the $0.050 support.
Technical Indicators
4-hours MACD – The MACD for TRX/USD is gaining momentum in the bullish zone.
4-hours RSI (Relative Strength Index) – The RSI for TRX/USD is currently above the 50 level.
Major Support Levels – $0.0550, $0.0542 and $0.0530.
Major Resistance Levels – $0.0562, $0.0575 and $0.0600.
Tron price is up over 5% and showing positive signs above $0.055 against the US Dollar. TRX could outperform bitcoin and rise further towards $0.060.
Tron price is trading in a positive zone well above the $0.0520 pivot level against the US dollar.
The price is showing positive signs above $0.055 and the 100 simple moving average (4-hours).
There is a major bullish trend line forming with support near $0.0530 on the 4-hours chart of the TRX/USD pair (data source from Kraken).
The pair is likely to start a fresh increase above the $0.0562 and $0.0575 resistance levels.
In the past few days, tron price remained strong above the $0.0520 level against the US Dollar, outperforming bitcoin and ethereum. TRX gained pace for a clear move above the $0.055 resistance and the 100 simple moving average (4-hours).
The price traded to a new weekly high at $0.0575 and it is currently correcting gains. There was a move below the 23.6% Fib retracement level of the recent rally from the $0.0519 low to $0.0575 high. Trx price is now trading above $0.055 and the 100 simple moving average (4-hours).
It is also above the 50% Fib retracement level of the recent rally from the $0.0519 low to $0.0575 high. On the upside, an initial resistance is near the $0.0562 level.
Source: TRXUSD on TradingView.com
The next major resistance is near the $0.0575 level, above which the bulls are likely to aim a larger increase towards the key $0.0600 zone in the coming sessions. Any more gains could set the pace for a move towards the $0.0645 level.
If TRX price fails to clear the $0.0575 barrier, it could correct lower. An initial support on the downside is near the $0.0550 zone, where the bulls are currently taking a stand.
The next major support is near the $0.0540 level and the 100 simple moving average (4-hours). The main support is near the trend line and $0.0530, below which there is a risk of a move towards the $0.050 support.
Technical Indicators
4-hours MACD – The MACD for TRX/USD is gaining momentum in the bullish zone.
4-hours RSI (Relative Strength Index) – The RSI for TRX/USD is currently above the 50 level.
Major Support Levels – $0.0550, $0.0542 and $0.0530.
Major Resistance Levels – $0.0562, $0.0575 and $0.0600.
Tags: TRONtron pricetrxusdTRXUSDT
NewsBTCRead More
Bitcoin’s recent price action confirms a clear structural breakdown, ending weeks of compression and shifting…
Bitcoin is currently trading around $66,400, which is almost 48% below its all-time high of…
The price of Bitcoin succumbed to bearish pressure and fell to around $65,500 on Friday,…
A worst-case scenario is now on the table. Some analysts say Bitcoin could fall as…
Across many of the most well-known ecosystems like Bitcoin, Ethereum, and Solana, responses are diverging…
The recent surge in oil and gas prices has driven up inflation expectations, causing markets…