Bitcoin is correcting losses and trading above $41,000 against the US Dollar. BTC could gain bullish momentum above $41,350 and $41,500.
Bitcoin remained well bid above $39,250 and started a fresh increase.
The price is now trading above $41,000 and the 100 hourly simple moving average.
There was a break above a connecting bearish trend line with resistance near $40,000 on the hourly chart of the BTC/USD pair (data feed from Kraken).
The pair could gain pace if there is a clear move above the $41,500 resistance zone.
Bitcoin Price Eyes Upside Break
Bitcoin price remained well bid above the $39,250 support zone. BTC formed a base and started a fresh increase above the $40,000 resistance zone.
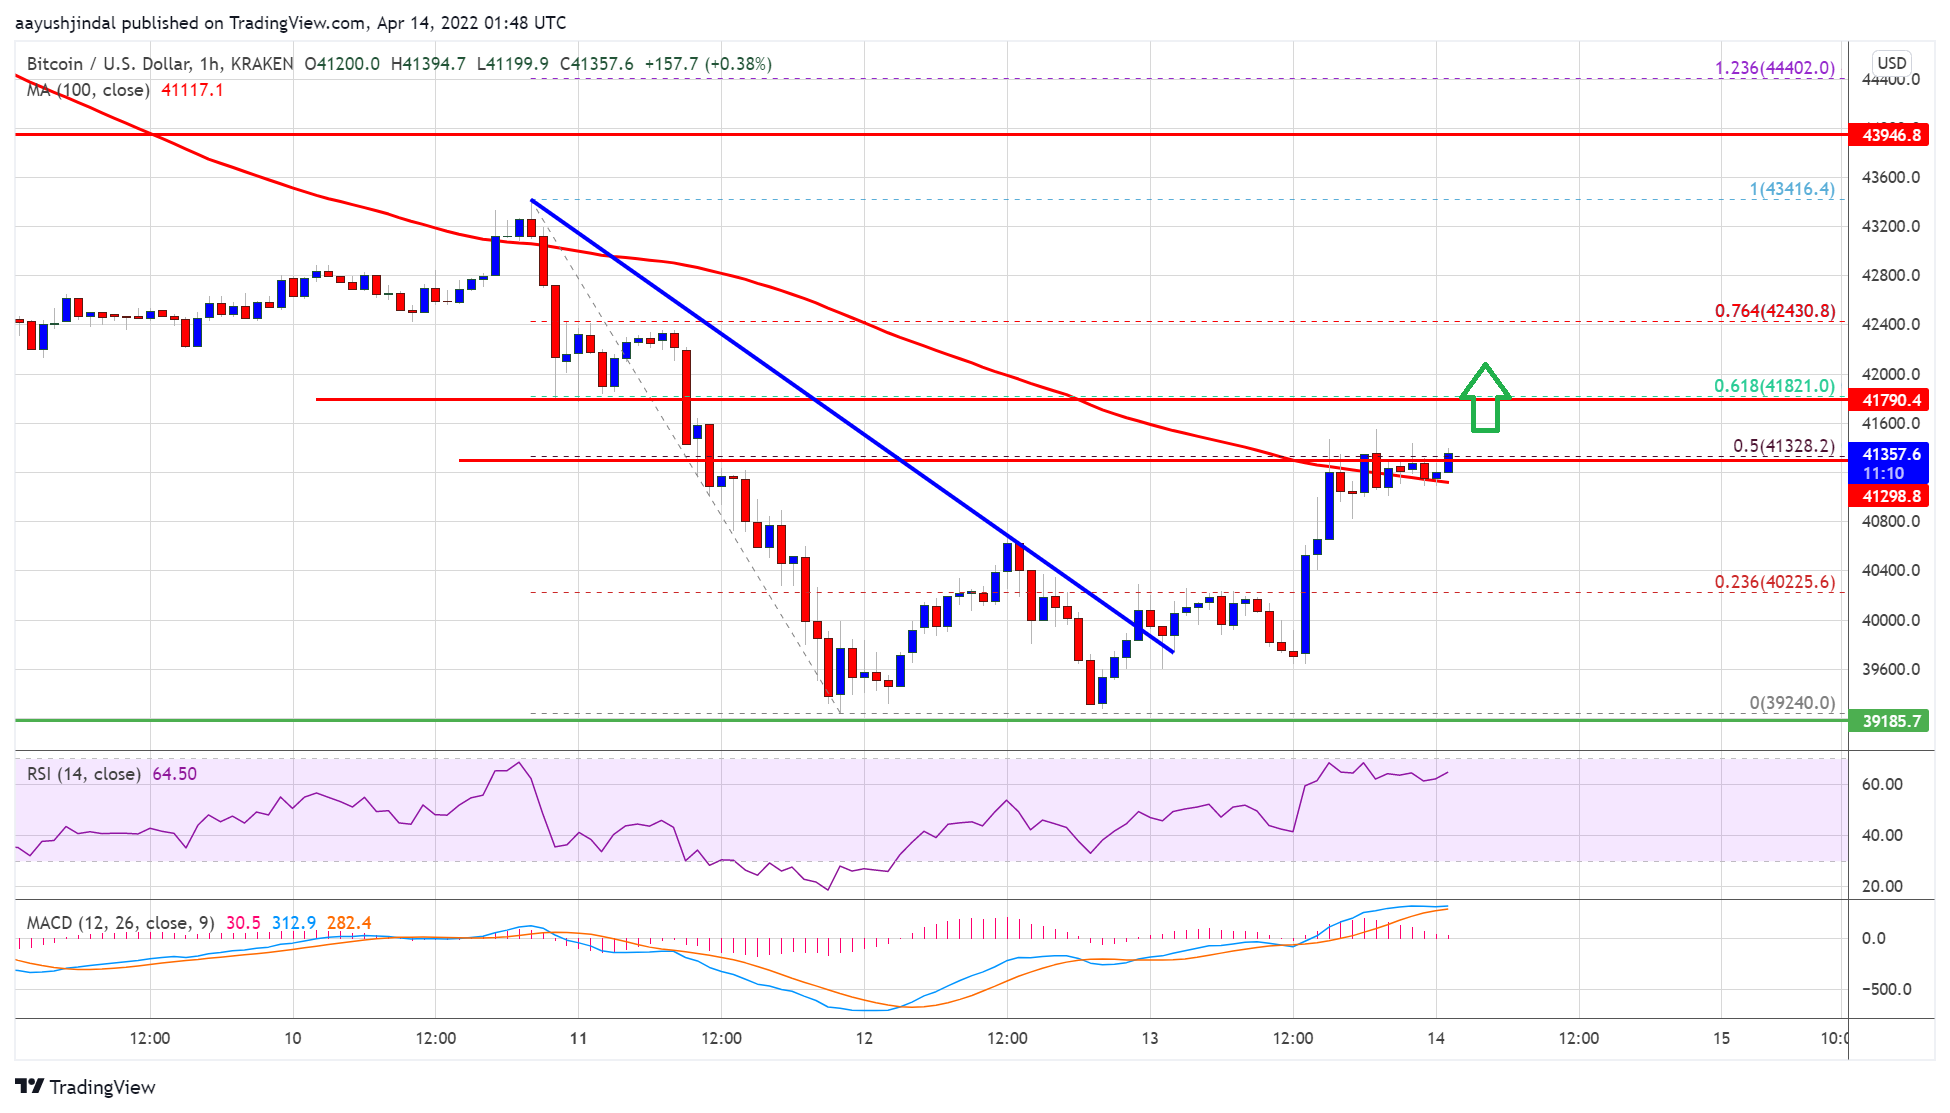
The bulls gained strength and were able to push the price above $40,500. There was a move above the 23.6% Fib retracement level of the main drop from the $43,415 swing high from the $39,240 low. Besides, there was a break above a connecting bearish trend line with resistance near $40,000 on the hourly chart of the BTC/USD pair.
The pair even broke the $41,000 resistance zone and settled above the 100 hourly simple moving average. An immediate resistance on the upside is near the $41,350 level.
The 50% Fib retracement level of the main drop from the $43,415 swing high from the $39,240 low is also near the $41,350 zone. The next key resistance could be $41,500. If the bulls able to clear the $41,350 and $41,500 resistance levels, the price could accelerate higher.
Source: BTCUSD on TradingView.com
In the stated case, the price may perhaps rise towards the $41,800 resistance zone. Any more gains could set the pace for a move towards the $42,500 level in the near term.
Another Decline in BTC?
If bitcoin fails to clear the $41,500 resistance zone, it could start another decline. An immediate support on the downside is near the $41,000 level.
The next major support is seen near the $40,550 level. A downside break below the $40,550 support zone could accelerate losses. In the stated case, the price could decline towards the $40,000 level or even $39,250.
Technical indicators:
Hourly MACD – The MACD is now gaining pace in the bullish zone.
Hourly RSI (Relative Strength Index) – The RSI for BTC/USD is now well above the 50 level.
Major Support Levels – $41,000, followed by $40,550.
Major Resistance Levels – $41,350, $41,500 and $41,800.
Bitcoin is correcting losses and trading above $41,000 against the US Dollar. BTC could gain bullish momentum above $41,350 and $41,500.
Bitcoin remained well bid above $39,250 and started a fresh increase.
The price is now trading above $41,000 and the 100 hourly simple moving average.
There was a break above a connecting bearish trend line with resistance near $40,000 on the hourly chart of the BTC/USD pair (data feed from Kraken).
The pair could gain pace if there is a clear move above the $41,500 resistance zone.
Bitcoin price remained well bid above the $39,250 support zone. BTC formed a base and started a fresh increase above the $40,000 resistance zone.
The bulls gained strength and were able to push the price above $40,500. There was a move above the 23.6% Fib retracement level of the main drop from the $43,415 swing high from the $39,240 low. Besides, there was a break above a connecting bearish trend line with resistance near $40,000 on the hourly chart of the BTC/USD pair.
The pair even broke the $41,000 resistance zone and settled above the 100 hourly simple moving average. An immediate resistance on the upside is near the $41,350 level.
The 50% Fib retracement level of the main drop from the $43,415 swing high from the $39,240 low is also near the $41,350 zone. The next key resistance could be $41,500. If the bulls able to clear the $41,350 and $41,500 resistance levels, the price could accelerate higher.
Source: BTCUSD on TradingView.com
In the stated case, the price may perhaps rise towards the $41,800 resistance zone. Any more gains could set the pace for a move towards the $42,500 level in the near term.
If bitcoin fails to clear the $41,500 resistance zone, it could start another decline. An immediate support on the downside is near the $41,000 level.
The next major support is seen near the $40,550 level. A downside break below the $40,550 support zone could accelerate losses. In the stated case, the price could decline towards the $40,000 level or even $39,250.
Technical indicators:
Hourly MACD – The MACD is now gaining pace in the bullish zone.
Hourly RSI (Relative Strength Index) – The RSI for BTC/USD is now well above the 50 level.
Major Support Levels – $41,000, followed by $40,550.
Major Resistance Levels – $41,350, $41,500 and $41,800.
Tags: bitcoinbtcusdBTCUSDTxbtusd
FeedzyRead More
As Bitcoin (BTC) recovers from its recent drop below the $75,000 support, some market observers…
Bitcoin’s recent drop below key support may have been more than just a bearish breakdown.…
Enflux says “the bid is there” but no one is adding size, while Glassnode data…
A closely watched on-chain indicator has returned to a range that has marked major turning…
Bitcoin price started a downside correction from the $78,000 zone. BTC is consolidating and might…
On-chain data shows a net amount of Bitcoin has been flowing into Binance for 10…