Bitcoin is recovering losses and trading above $43,000 against the US Dollar. BTC must clear $43,800 to continue higher in the near term.
Bitcoin found support near $41,600 and started a fresh upward move.
The price is trading above $43,000 and the 100 hourly simple moving average.
There was a break above a key bearish trend line with resistance near $42,250 on the hourly chart of the BTC/USD pair (data feed from Kraken).
The pair could continue to rise if there is a clear move above the $43,800 resistance.
Bitcoin Price Starts Recovery
Bitcoin price extended decline below the $42,000 support zone. However, BTC found support above the $41,500 zone. A low was formed near $41,573 and the price started a decent recovery wave.
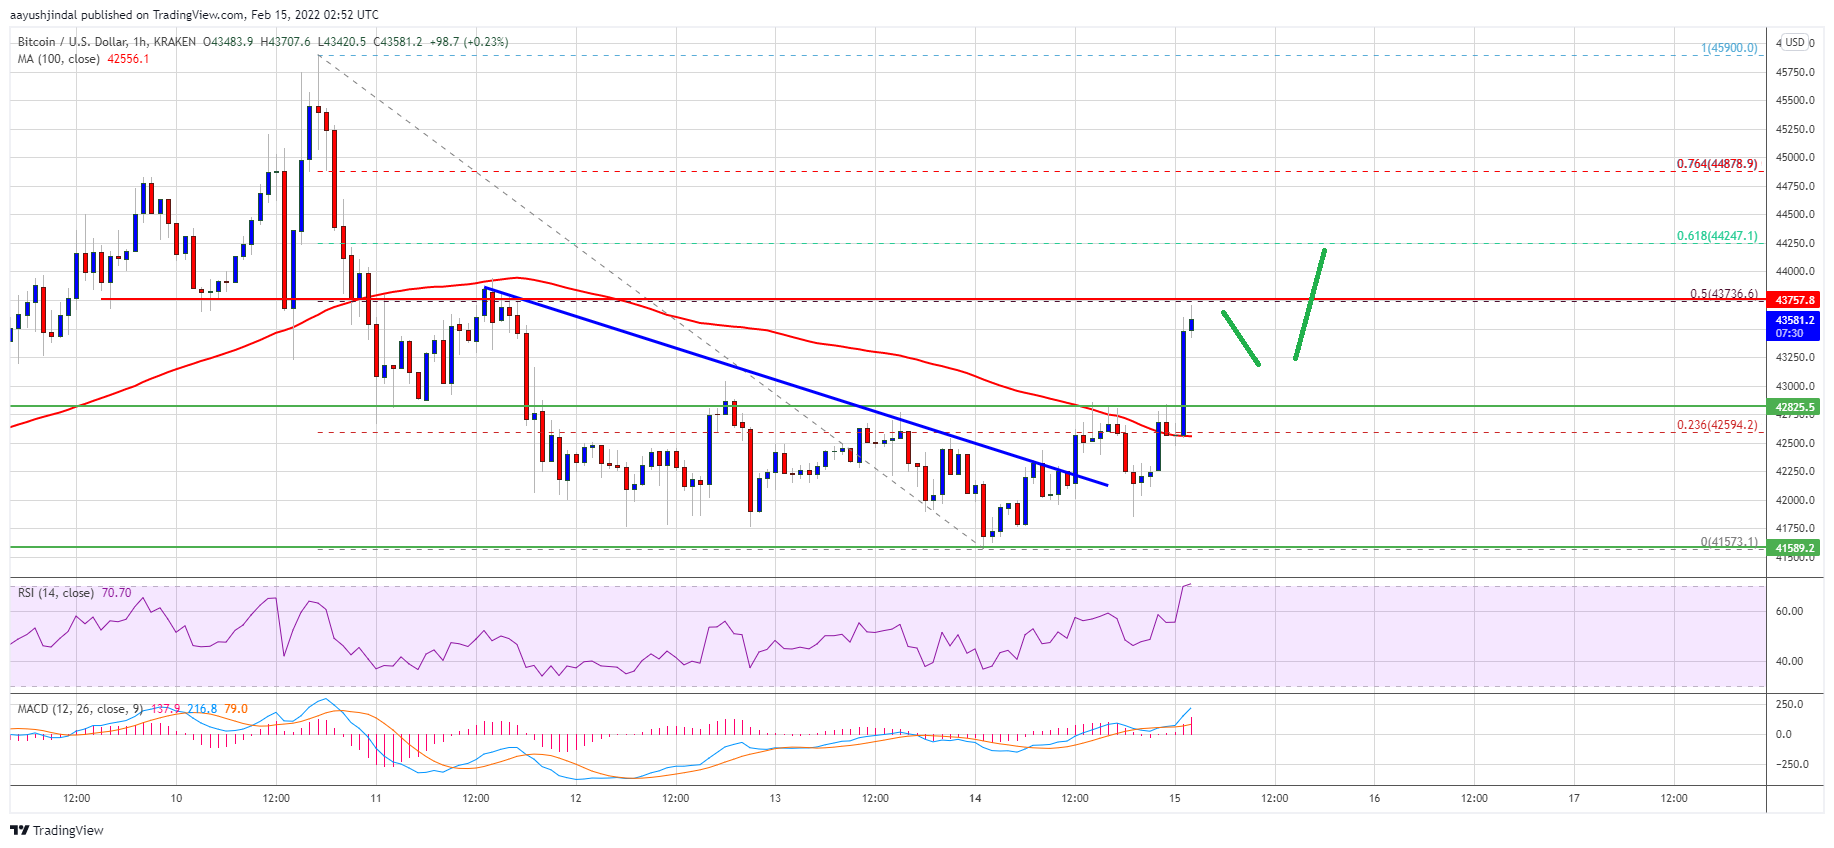
There was a break above the $42,000 and $42,500 resistance levels. The price climbed above the 23.6% Fib retracement level of the key decline from the $45,900 high to $41,570 low. Besides, there was a break above a key bearish trend line with resistance near $42,250 on the hourly chart of the BTC/USD pair.
Bitcoin is now trading above $43,000 and the 100 hourly simple moving average. It even broke the $43,500 resistance zone. However, the bulls are now facing resistance near the $43,800 zone.
Source: BTCUSD on TradingView.com
The 50% Fib retracement level of the key decline from the $45,900 high to $41,570 low is also near the $43,800 zone. A clear move above the $43,800 resistance zone might send the price further higher. The next major resistance is near $44,850, above which the price might rise towards the $45,500 resistance level.
Fresh Decline in BTC?
If bitcoin fails to continue higher above the $43,800 resistance zone, it could start a downside correction. An immediate support on the downside is near the $43,200 zone.
The next major support is seen near the $42,850 level (the recent breakout zone). If there is a downside break below the $42,850 support zone, the price might start a fresh decline. The next support sits near $42,000, below which there is a risk of a new low below $41,570.
Technical indicators:
Hourly MACD – The MACD is now gaining pace in the bullish zone.
Hourly RSI (Relative Strength Index) – The RSI for BTC/USD is now above the 50 level.
Major Support Levels – $43,000, followed by $42,850.
Major Resistance Levels – $43,800, $44,850 and $45,500.
Bitcoin is recovering losses and trading above $43,000 against the US Dollar. BTC must clear $43,800 to continue higher in the near term.
Bitcoin found support near $41,600 and started a fresh upward move.
The price is trading above $43,000 and the 100 hourly simple moving average.
There was a break above a key bearish trend line with resistance near $42,250 on the hourly chart of the BTC/USD pair (data feed from Kraken).
The pair could continue to rise if there is a clear move above the $43,800 resistance.
Bitcoin price extended decline below the $42,000 support zone. However, BTC found support above the $41,500 zone. A low was formed near $41,573 and the price started a decent recovery wave.
There was a break above the $42,000 and $42,500 resistance levels. The price climbed above the 23.6% Fib retracement level of the key decline from the $45,900 high to $41,570 low. Besides, there was a break above a key bearish trend line with resistance near $42,250 on the hourly chart of the BTC/USD pair.
Bitcoin is now trading above $43,000 and the 100 hourly simple moving average. It even broke the $43,500 resistance zone. However, the bulls are now facing resistance near the $43,800 zone.
Source: BTCUSD on TradingView.com
The 50% Fib retracement level of the key decline from the $45,900 high to $41,570 low is also near the $43,800 zone. A clear move above the $43,800 resistance zone might send the price further higher. The next major resistance is near $44,850, above which the price might rise towards the $45,500 resistance level.
If bitcoin fails to continue higher above the $43,800 resistance zone, it could start a downside correction. An immediate support on the downside is near the $43,200 zone.
The next major support is seen near the $42,850 level (the recent breakout zone). If there is a downside break below the $42,850 support zone, the price might start a fresh decline. The next support sits near $42,000, below which there is a risk of a new low below $41,570.
Technical indicators:
Hourly MACD – The MACD is now gaining pace in the bullish zone.
Hourly RSI (Relative Strength Index) – The RSI for BTC/USD is now above the 50 level.
Major Support Levels – $43,000, followed by $42,850.
Major Resistance Levels – $43,800, $44,850 and $45,500.
Tags: bitcoinbtcusdBTCUSDTxbtusd
FeedzyRead More
TL;DR GameStop’s Form 10-Q includes digital asset custody risk disclosures. The filing discusses circumstances in…
TL;DR Coinbase’s Quantum Advisory Council published a report on post-quantum migration and abandoned coins. The…
TL;DR Crypto Rover says Bitcoin has never bottomed below electrical production cost, currently estimated at…
TL;DR X trader Cup says Bitcoin may be in a quiet accumulation phase before a…
The largest company on public markets now holds bitcoin as a treasury reserve, not as…
TL;DR Kalshi Crypto says its market shows a 69% chance Bitcoin hits $50,000 before $100,000.…