Bitcoin is recovering losses and trading above $43,000 against the US Dollar. BTC must clear $43,800 to continue higher in the near term.
Bitcoin found support near $41,600 and started a fresh upward move.
The price is trading above $43,000 and the 100 hourly simple moving average.
There was a break above a key bearish trend line with resistance near $42,250 on the hourly chart of the BTC/USD pair (data feed from Kraken).
The pair could continue to rise if there is a clear move above the $43,800 resistance.
Bitcoin Price Starts Recovery
Bitcoin price extended decline below the $42,000 support zone. However, BTC found support above the $41,500 zone. A low was formed near $41,573 and the price started a decent recovery wave.
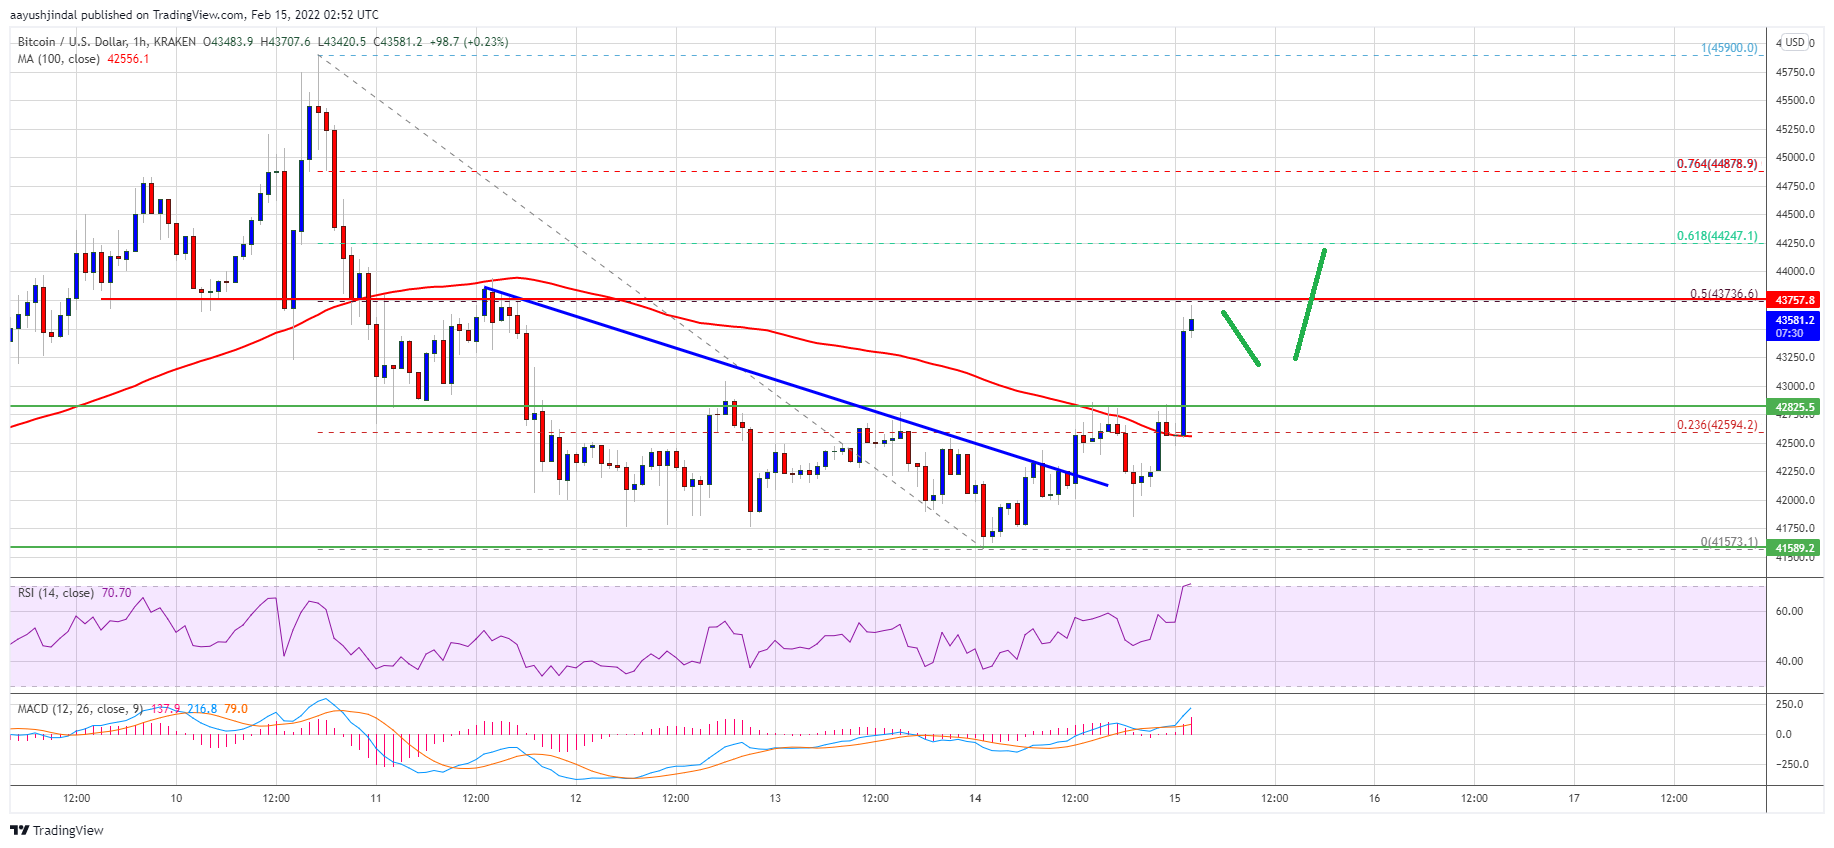
There was a break above the $42,000 and $42,500 resistance levels. The price climbed above the 23.6% Fib retracement level of the key decline from the $45,900 high to $41,570 low. Besides, there was a break above a key bearish trend line with resistance near $42,250 on the hourly chart of the BTC/USD pair.
Bitcoin is now trading above $43,000 and the 100 hourly simple moving average. It even broke the $43,500 resistance zone. However, the bulls are now facing resistance near the $43,800 zone.
Source: BTCUSD on TradingView.com
The 50% Fib retracement level of the key decline from the $45,900 high to $41,570 low is also near the $43,800 zone. A clear move above the $43,800 resistance zone might send the price further higher. The next major resistance is near $44,850, above which the price might rise towards the $45,500 resistance level.
Fresh Decline in BTC?
If bitcoin fails to continue higher above the $43,800 resistance zone, it could start a downside correction. An immediate support on the downside is near the $43,200 zone.
The next major support is seen near the $42,850 level (the recent breakout zone). If there is a downside break below the $42,850 support zone, the price might start a fresh decline. The next support sits near $42,000, below which there is a risk of a new low below $41,570.
Technical indicators:
Hourly MACD – The MACD is now gaining pace in the bullish zone.
Hourly RSI (Relative Strength Index) – The RSI for BTC/USD is now above the 50 level.
Major Support Levels – $43,000, followed by $42,850.
Major Resistance Levels – $43,800, $44,850 and $45,500.
Bitcoin is recovering losses and trading above $43,000 against the US Dollar. BTC must clear $43,800 to continue higher in the near term.
Bitcoin found support near $41,600 and started a fresh upward move.
The price is trading above $43,000 and the 100 hourly simple moving average.
There was a break above a key bearish trend line with resistance near $42,250 on the hourly chart of the BTC/USD pair (data feed from Kraken).
The pair could continue to rise if there is a clear move above the $43,800 resistance.
Bitcoin price extended decline below the $42,000 support zone. However, BTC found support above the $41,500 zone. A low was formed near $41,573 and the price started a decent recovery wave.
There was a break above the $42,000 and $42,500 resistance levels. The price climbed above the 23.6% Fib retracement level of the key decline from the $45,900 high to $41,570 low. Besides, there was a break above a key bearish trend line with resistance near $42,250 on the hourly chart of the BTC/USD pair.
Bitcoin is now trading above $43,000 and the 100 hourly simple moving average. It even broke the $43,500 resistance zone. However, the bulls are now facing resistance near the $43,800 zone.
Source: BTCUSD on TradingView.com
The 50% Fib retracement level of the key decline from the $45,900 high to $41,570 low is also near the $43,800 zone. A clear move above the $43,800 resistance zone might send the price further higher. The next major resistance is near $44,850, above which the price might rise towards the $45,500 resistance level.
If bitcoin fails to continue higher above the $43,800 resistance zone, it could start a downside correction. An immediate support on the downside is near the $43,200 zone.
The next major support is seen near the $42,850 level (the recent breakout zone). If there is a downside break below the $42,850 support zone, the price might start a fresh decline. The next support sits near $42,000, below which there is a risk of a new low below $41,570.
Technical indicators:
Hourly MACD – The MACD is now gaining pace in the bullish zone.
Hourly RSI (Relative Strength Index) – The RSI for BTC/USD is now above the 50 level.
Major Support Levels – $43,000, followed by $42,850.
Major Resistance Levels – $43,800, $44,850 and $45,500.
Tags: bitcoinbtcusdBTCUSDTxbtusd
FeedzyRead More
Crypto analyst Merlijn revealed that Bitcoin has flashed the most powerful fractal in the markets…
Bitcoin has again come under sharp criticism after former UK Prime Minister Boris Johnson questioned…
Bitcoin is showing early signs of renewed demand after a February stretch marked by heavy…
Here, Wellener offers tactics that firms must use to prove they’re more than just a…
A $1.18 billion preferred stock raise, roughly equivalent to 16,800 BTC, signals a shift away…
Bitcoin Magazine Capital B Raises €3 Million to Expand Bitcoin Treasury Holdings Capital B, also…