Bitcoin is consolidating below the $48,000 resistance against the US Dollar. BTC could start a fresh rally if it clears the $48,000 resistance zone.
Bitcoin is stable above the $47,000 and $46,800 support levels.
The price is trading above $46,500 and the 100 hourly simple moving average.
There is a major breakout pattern forming with resistance near $47,700 on the hourly chart of the BTC/USD pair (data feed from Kraken).
The pair could start a fresh increase if it manages to clear the $48,000 resistance zone.
Bitcoin Price Eyes Fresh Increase
Bitcoin price started a minor downside correction after it failed near the $48,200 level. BTC corrected lower and traded below the $47,800 support level.
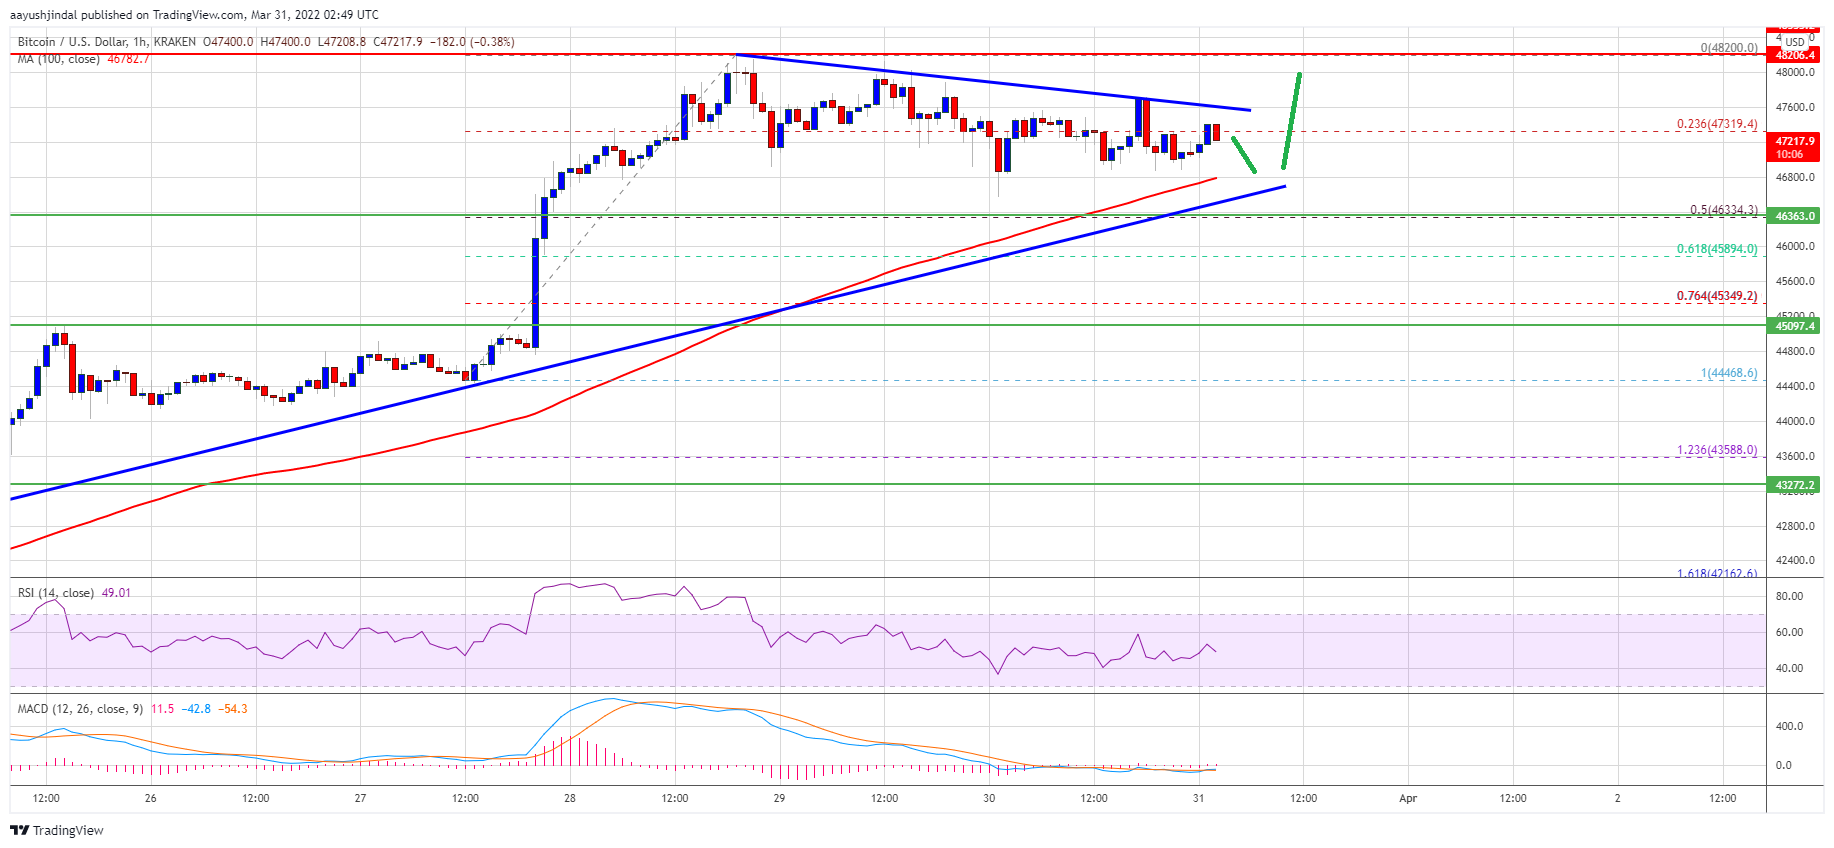
There was a move below the 23.6% Fib retracement level of the upward move from the $44,469 swing low $48,200 high. The price even moved below the $47,000 level, but the bulls were active near the $46,800 and $46,500 levels.
Bitcoin is now trading above $46,500 and the 100 hourly simple moving average. On the upside, the price is facing resistance near the $47,600 level.
There is also a major breakout pattern forming with resistance near $47,700 on the hourly chart of the BTC/USD pair. The next major resistance could be near the $48,000 zone. A successful break and close above the triangle resistance and then $48,000 could start a strong increase.
Source: BTCUSD on TradingView.com
The next major hurdle on the upside might be near the $49,200 level. Any more gains could send the price towards the key the $50,000 level.
Dips Limited in BTC?
If bitcoin fails to clear the $47,700 resistance zone, it could correct further lower. An immediate support on the downside is near the $47,000 zone. The next major support is seen near the $46,800 level and the 100 hourly simple moving average.
The main support now sits near the $46,400 level. It is near the 50% Fib retracement level of the upward move from the $44,469 swing low $48,200 high. A downside break below the $46,400 support zone could send the price to $45,000 in the near term.
Technical indicators:
Hourly MACD – The MACD is slowly gaining pace in the bullish zone.
Hourly RSI (Relative Strength Index) – The RSI for BTC/USD is now just above the 50 level.
Major Support Levels – $46,800, followed by $46,400.
Major Resistance Levels – $47,700, $48,000 and $48,200.
Bitcoin is consolidating below the $48,000 resistance against the US Dollar. BTC could start a fresh rally if it clears the $48,000 resistance zone.
Bitcoin is stable above the $47,000 and $46,800 support levels.
The price is trading above $46,500 and the 100 hourly simple moving average.
There is a major breakout pattern forming with resistance near $47,700 on the hourly chart of the BTC/USD pair (data feed from Kraken).
The pair could start a fresh increase if it manages to clear the $48,000 resistance zone.
Bitcoin price started a minor downside correction after it failed near the $48,200 level. BTC corrected lower and traded below the $47,800 support level.
There was a move below the 23.6% Fib retracement level of the upward move from the $44,469 swing low $48,200 high. The price even moved below the $47,000 level, but the bulls were active near the $46,800 and $46,500 levels.
Bitcoin is now trading above $46,500 and the 100 hourly simple moving average. On the upside, the price is facing resistance near the $47,600 level.
There is also a major breakout pattern forming with resistance near $47,700 on the hourly chart of the BTC/USD pair. The next major resistance could be near the $48,000 zone. A successful break and close above the triangle resistance and then $48,000 could start a strong increase.
Source: BTCUSD on TradingView.com
The next major hurdle on the upside might be near the $49,200 level. Any more gains could send the price towards the key the $50,000 level.
If bitcoin fails to clear the $47,700 resistance zone, it could correct further lower. An immediate support on the downside is near the $47,000 zone. The next major support is seen near the $46,800 level and the 100 hourly simple moving average.
The main support now sits near the $46,400 level. It is near the 50% Fib retracement level of the upward move from the $44,469 swing low $48,200 high. A downside break below the $46,400 support zone could send the price to $45,000 in the near term.
Technical indicators:
Hourly MACD – The MACD is slowly gaining pace in the bullish zone.
Hourly RSI (Relative Strength Index) – The RSI for BTC/USD is now just above the 50 level.
Major Support Levels – $46,800, followed by $46,400.
Major Resistance Levels – $47,700, $48,000 and $48,200.
Tags: bitcoinbtcusdBTCUSDTxbtusd
FeedzyRead More
BitMEX is facing a proposed class action in the Southern District of New York seeking…
Bitcoin Magazine Morgan Stanley Bitcoin ETF Nearly Notches $400M in Assets Wall Street giant Morgan…
Poolin Technology has filed for Chapter 11 bankruptcy protection, setting up an orderly wind-down and…
Bitcoin Magazine State Department to Debut Freedom Tech Program with Bitcoin Policy Institute, Palantir as…
Elliptic has published a new report explaining how Bitcoin ATM scams work, and the most…
Michael Saylor's Strategy — under continued pressure in this crypto bear market — released a…