Bitcoin started another decline below the $40,000 level against the US Dollar. BTC could extend losses if it stays below the $40,000 resistance zone.
Bitcoin started another decline after it failed to clear the $40,000 resistance zone.
The price is now trading below $39,500 and the 100 hourly simple moving average.
There is a key bearish trend line forming with resistance near $39,500 on the hourly chart of the BTC/USD pair (data feed from Kraken).
The pair could start a major decline if there is a close below the $38,800 level.
Bitcoin Price Gains Bearish Momentum
Bitcoin price settled below the $40,500 level to move into a bearish zone. BTC traded below the $40,000 support level and settled below the 100 hourly simple moving average to move into a bearish zone.
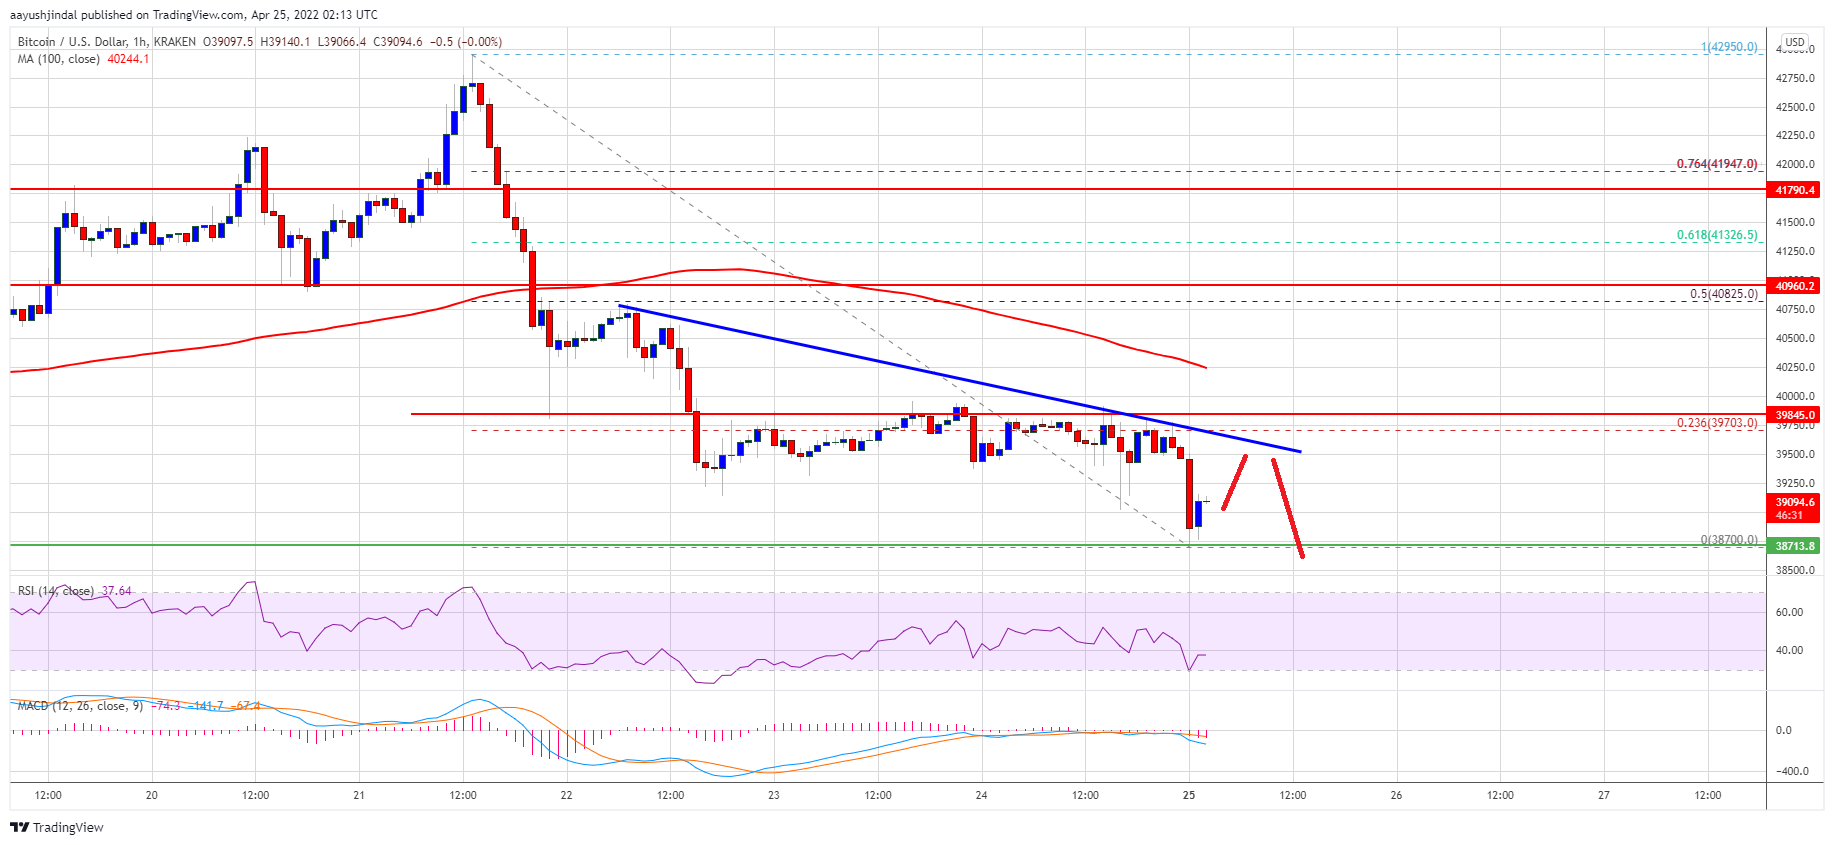
The price even traded below the $39,200 support level. A low is formed near $38,700 and the price is now consolidating losses. An immediate resistance on the upside is near the $39,500 level. There is also a key bearish trend line forming with resistance near $39,500 on the hourly chart of the BTC/USD pair.
The next key resistance could be $39,700 or the 23.6% Fib retracement level of the recent decline from the $42,950 swing high to $38,700 low.
The first major resistance is now forming near the $40,000 level. The main resistance sits near $40,500 and the 100 hourly simple moving average. To start a strong upward move, the price must settle above the $40,500 zone and the 100 hourly simple moving average.
Source: BTCUSD on TradingView.com
In the stated case, the price could even surpass the 50% Fib retracement level of the recent decline from the $42,950 swing high to $38,700 low.
More Losses in BTC?
If bitcoin fails to clear the $40,000 resistance zone, it could continue to move down. An immediate support on the downside is near the $39,000 level.
The next major support is seen near the $38,800 level. A downside break below the $38,800 zone could send the price towards the $37,500 support zone.
Technical indicators:
Hourly MACD – The MACD is slowly gaining pace in the bearish zone.
Hourly RSI (Relative Strength Index) – The RSI for BTC/USD is now below the 50 level.
Major Support Levels – $39,000, followed by $38,800.
Major Resistance Levels – $39,500, $39,800 and $40,000.
Bitcoin started another decline below the $40,000 level against the US Dollar. BTC could extend losses if it stays below the $40,000 resistance zone.
Bitcoin started another decline after it failed to clear the $40,000 resistance zone.
The price is now trading below $39,500 and the 100 hourly simple moving average.
There is a key bearish trend line forming with resistance near $39,500 on the hourly chart of the BTC/USD pair (data feed from Kraken).
The pair could start a major decline if there is a close below the $38,800 level.
Bitcoin price settled below the $40,500 level to move into a bearish zone. BTC traded below the $40,000 support level and settled below the 100 hourly simple moving average to move into a bearish zone.
The price even traded below the $39,200 support level. A low is formed near $38,700 and the price is now consolidating losses. An immediate resistance on the upside is near the $39,500 level. There is also a key bearish trend line forming with resistance near $39,500 on the hourly chart of the BTC/USD pair.
The next key resistance could be $39,700 or the 23.6% Fib retracement level of the recent decline from the $42,950 swing high to $38,700 low.
The first major resistance is now forming near the $40,000 level. The main resistance sits near $40,500 and the 100 hourly simple moving average. To start a strong upward move, the price must settle above the $40,500 zone and the 100 hourly simple moving average.
Source: BTCUSD on TradingView.com
In the stated case, the price could even surpass the 50% Fib retracement level of the recent decline from the $42,950 swing high to $38,700 low.
If bitcoin fails to clear the $40,000 resistance zone, it could continue to move down. An immediate support on the downside is near the $39,000 level.
The next major support is seen near the $38,800 level. A downside break below the $38,800 zone could send the price towards the $37,500 support zone.
Technical indicators:
Hourly MACD – The MACD is slowly gaining pace in the bearish zone.
Hourly RSI (Relative Strength Index) – The RSI for BTC/USD is now below the 50 level.
Major Support Levels – $39,000, followed by $38,800.
Major Resistance Levels – $39,500, $39,800 and $40,000.
Tags: bitcoinbtcusdBTCUSDTxbtusd
FeedzyRead More
Executive John Ameriks emphasized Vanguard's core view of the crypto sector hasn't changed, seeing the…
The recommendation is in line with other global asset managers like BlackRock and Bank of…
The Bitcoin market is experiencing a gradual trend reversal following weeks of prolonged price correction…
Rising Japanese rates and a stronger yen threaten carry trades and could pressure crypto markets…
As Bitcoin (BTC) tries to hold the $90,000 barrier, some analysts affirm that the flagship…
XRP is in a mild undervalued zone according to the 30-day MVRV Ratio. Here’s how…