Bitcoin started a fresh decline from the $48,000 resistance against the US Dollar. BTC remains at a risk of a sharp decline below the $46,000 support zone.
Bitcoin started a fresh decline after it failed to clear the $48,000 resistance level.
The price is trading below $47,000 and the 100 hourly simple moving average.
There is a key bearish trend line forming with resistance near $47,100 on the hourly chart of the BTC/USD pair (data feed from Kraken).
The pair remains at a risk of a major decline if there is a clear move below $46,000.
Bitcoin Price Remains At Risk
Bitcoin price failed to climb above $48,000 and started another decline. BTC traded below the $47,500 and $47,200 levels to move further into a bearish zone.
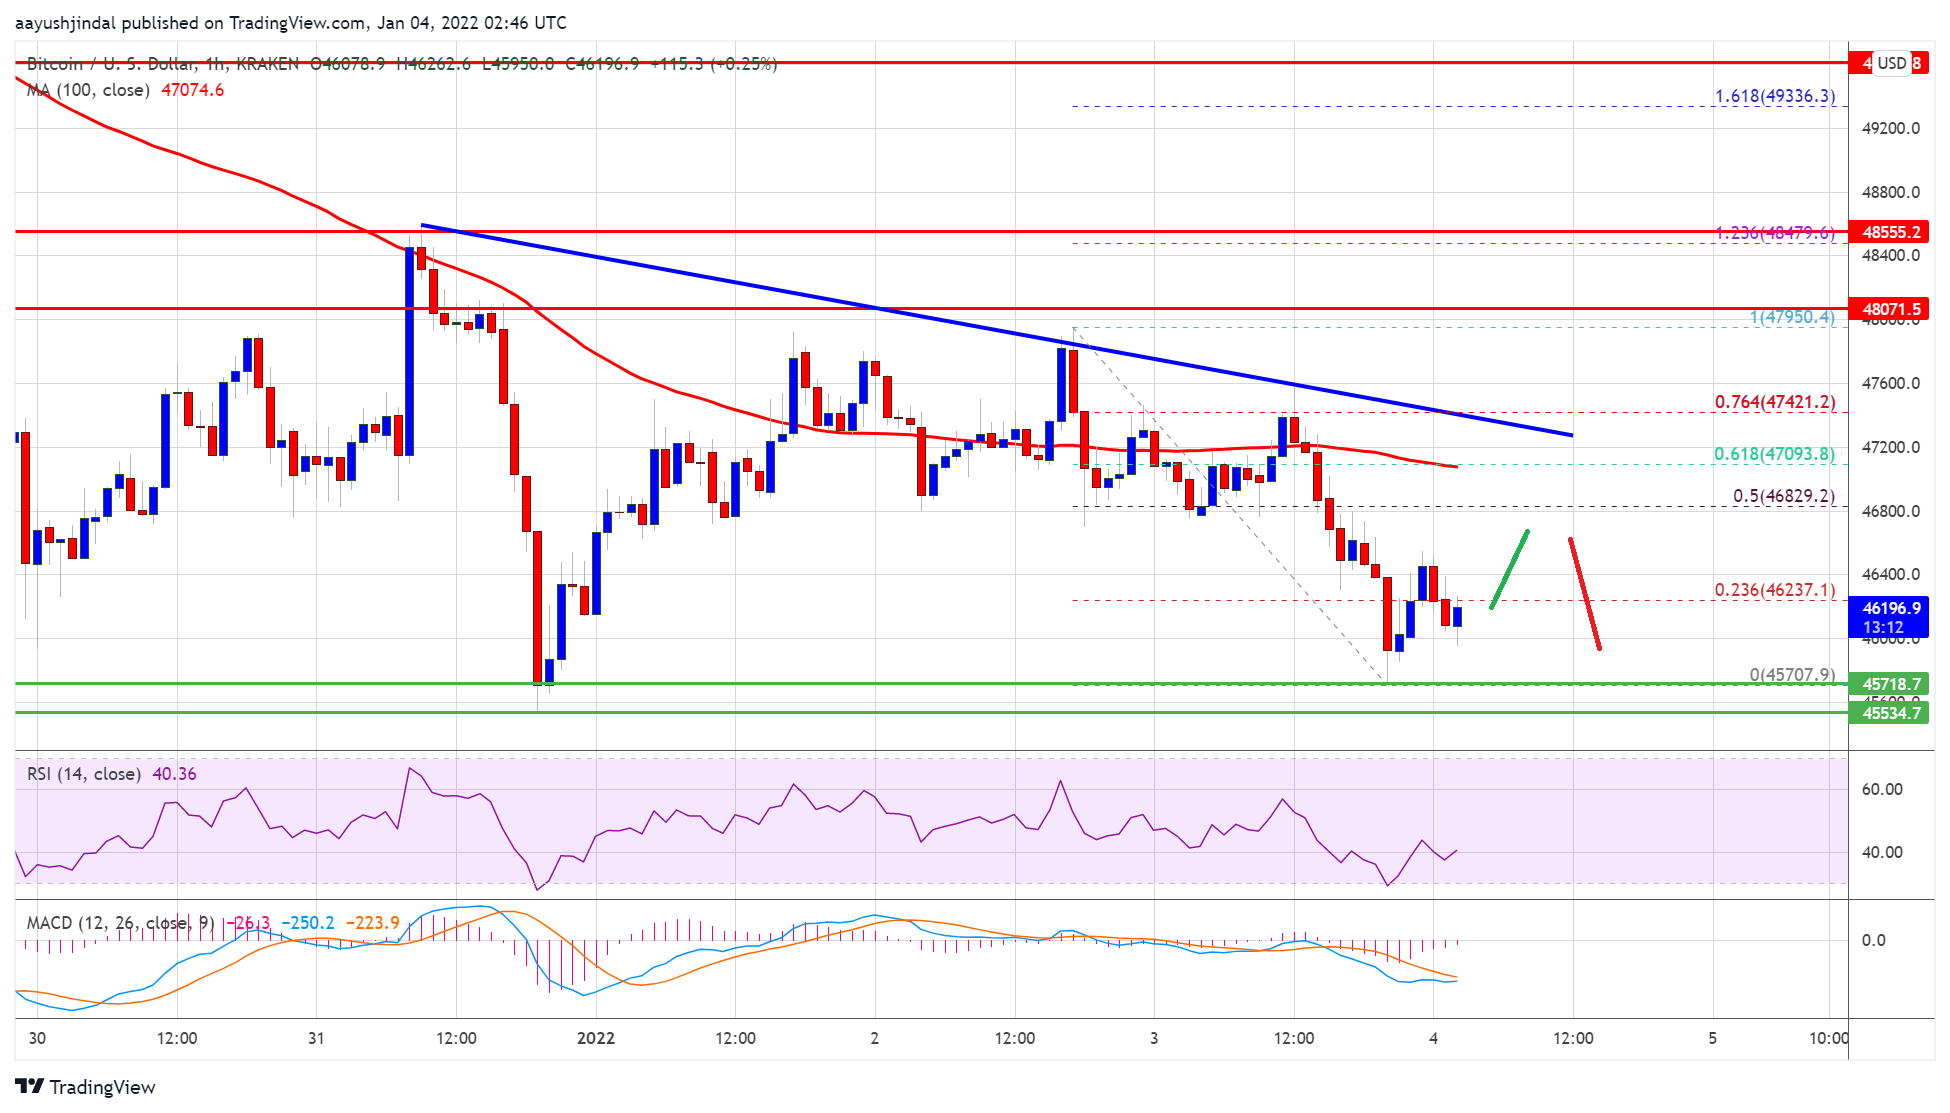
The price even moved below the $46,500 level and the 100 hourly simple moving average. A low was formed near $45,707 and the price is now consolidating losses. It tested the 23.6% Fib retracement level of the recent decline from the $47,950 swing high to $45,707 low.
Bitcoin price is now trading below $47,000 and the 100 hourly simple moving average. The first major resistance on the upside is near the $46,850 level. It is near the 50% Fib retracement level of the recent decline from the $47,950 swing high to $45,707 low.
Source: BTCUSD on TradingView.com
Besides, there is a key bearish trend line forming with resistance near $47,100 on the hourly chart of the BTC/USD pair. A clear move above the $47,000 resistance zone and the trend line could start a fresh increase. The next major resistance is near the $48,000 level. Any more gains could send the price towards the $48,500 level in the near term.
More Losses In BTC?
If bitcoin fails to recover above $47,000, it could continue to move down. An immediate support is near the $46,000 zone. The first major support is near $45,800.
A downside break below the $45,800 level could push the price further lower. In the stated case, the price may possibly decline towards the $43,500 level in the coming sessions.
Technical indicators:
Hourly MACD – The MACD is now gaining pace in the bearish zone.
Hourly RSI (Relative Strength Index) – The RSI for BTC/USD is below the 50 level.
Major Support Levels – $46,000, followed by $45,800.
Major Resistance Levels – $46,800, $47,000 and $47,100.
Bitcoin started a fresh decline from the $48,000 resistance against the US Dollar. BTC remains at a risk of a sharp decline below the $46,000 support zone.
Bitcoin started a fresh decline after it failed to clear the $48,000 resistance level.
The price is trading below $47,000 and the 100 hourly simple moving average.
There is a key bearish trend line forming with resistance near $47,100 on the hourly chart of the BTC/USD pair (data feed from Kraken).
The pair remains at a risk of a major decline if there is a clear move below $46,000.
Bitcoin price failed to climb above $48,000 and started another decline. BTC traded below the $47,500 and $47,200 levels to move further into a bearish zone.
The price even moved below the $46,500 level and the 100 hourly simple moving average. A low was formed near $45,707 and the price is now consolidating losses. It tested the 23.6% Fib retracement level of the recent decline from the $47,950 swing high to $45,707 low.
Bitcoin price is now trading below $47,000 and the 100 hourly simple moving average. The first major resistance on the upside is near the $46,850 level. It is near the 50% Fib retracement level of the recent decline from the $47,950 swing high to $45,707 low.
Source: BTCUSD on TradingView.com
Besides, there is a key bearish trend line forming with resistance near $47,100 on the hourly chart of the BTC/USD pair. A clear move above the $47,000 resistance zone and the trend line could start a fresh increase. The next major resistance is near the $48,000 level. Any more gains could send the price towards the $48,500 level in the near term.
If bitcoin fails to recover above $47,000, it could continue to move down. An immediate support is near the $46,000 zone. The first major support is near $45,800.
A downside break below the $45,800 level could push the price further lower. In the stated case, the price may possibly decline towards the $43,500 level in the coming sessions.
Technical indicators:
Hourly MACD – The MACD is now gaining pace in the bearish zone.
Hourly RSI (Relative Strength Index) – The RSI for BTC/USD is below the 50 level.
Major Support Levels – $46,000, followed by $45,800.
Major Resistance Levels – $46,800, $47,000 and $47,100.
Tags: bitcoinbtcusdBTCUSDTxbtusd
FeedzyRead More
Bitcoin and software equities have sharply diverged after moving in lockstep for years, raising questions…
Bitcoin and ether fell Monday after dropping in May, a month that usually sees them…
U.S. spot bitcoin ETFs lost $2.97 billion across 10 trading days through Friday, the longest…
Bitcoin price started a fresh decline below the $73,800 zone. BTC is consolidating and might…
The creator of the Mayer Multiple argues bitcoin’s growing economic substance is compressing volatility and…
Prominent crypto analysis page XWIN Research Japan reports that Bitcoin has reached a new milestone:…