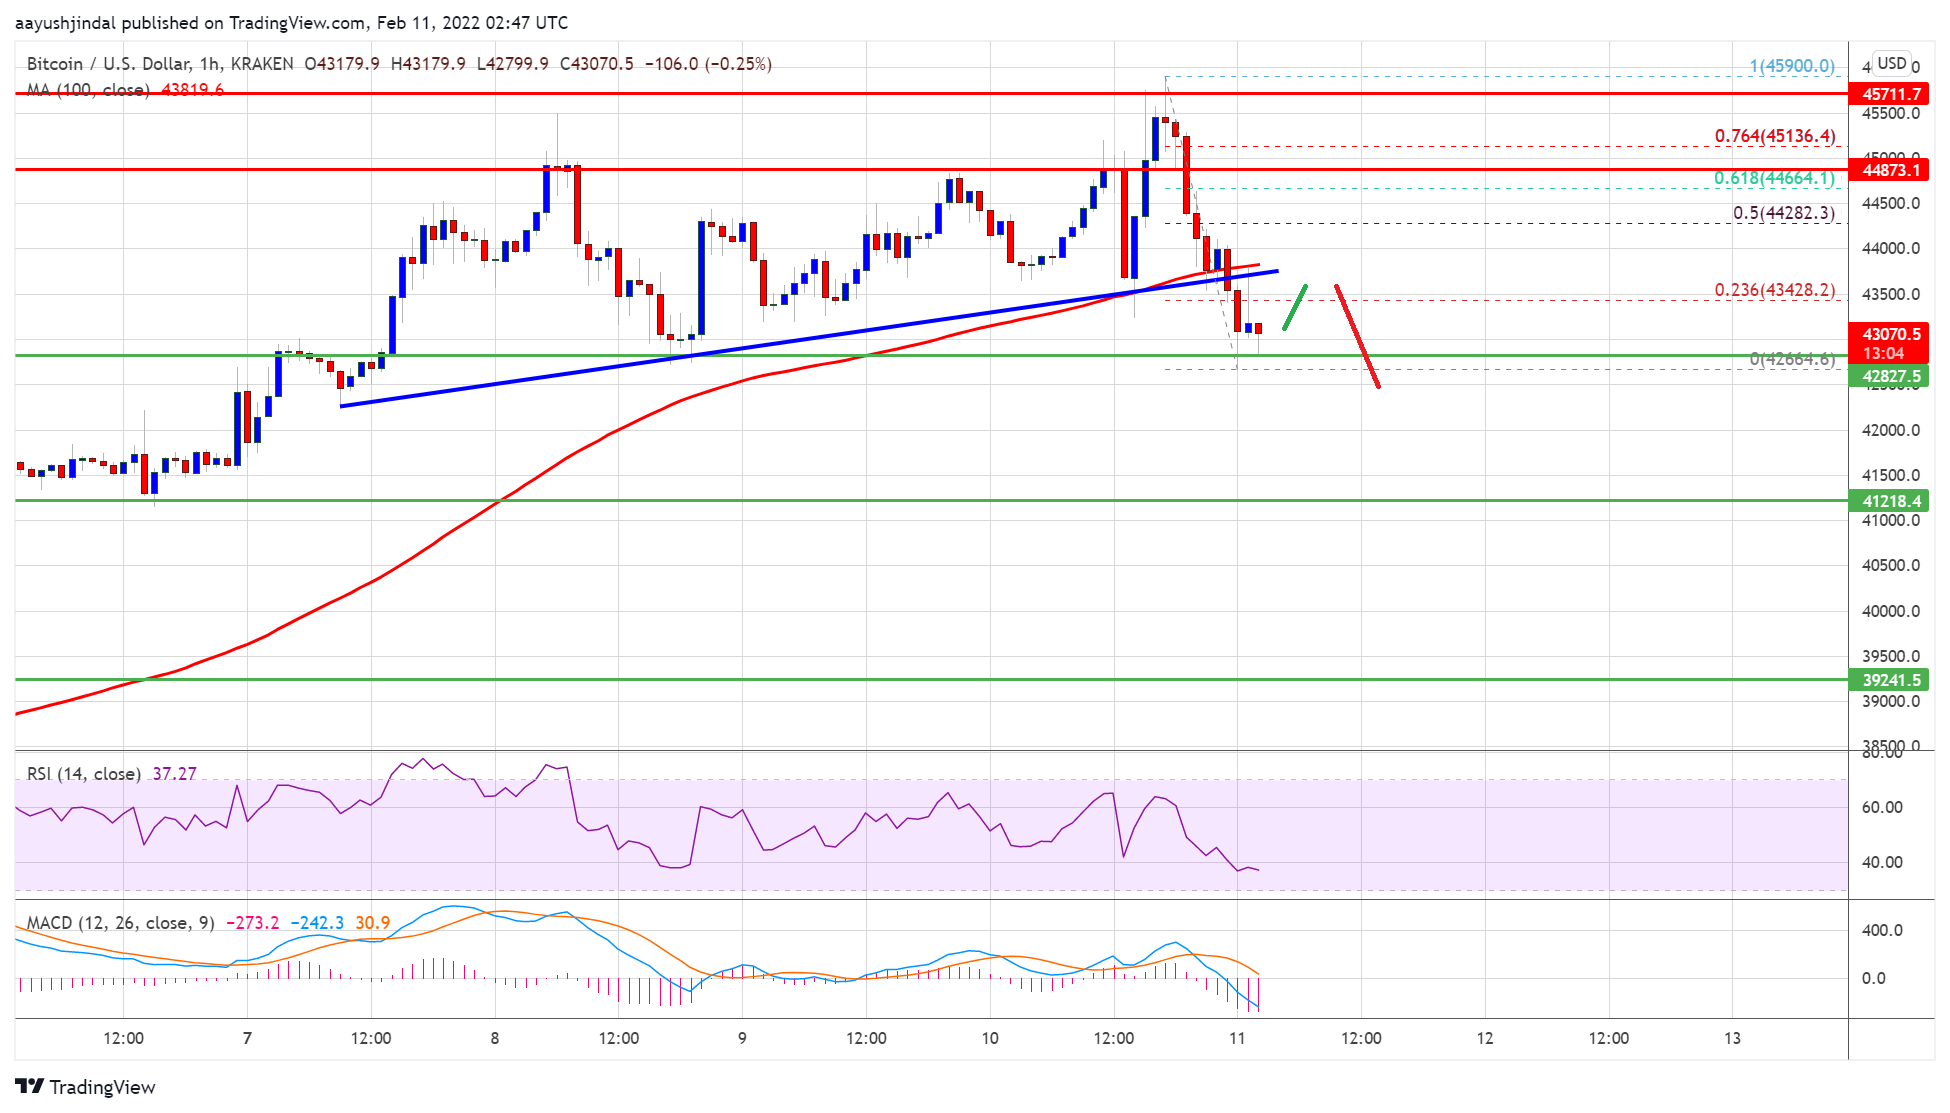
Bitcoin failed again to clear the $45,500 resistance zone against the US Dollar. BTC is declining and remains at a risk of more losses below $42,500.
Bitcoin attempted another upside break above $45,500 but failed.
The price is trading below $43,500 and the 100 hourly simple moving average.
There was a break below a key bullish trend line with support near $43,500 on the hourly chart of the BTC/USD pair (data feed from Kraken).
The pair could decline sharply if there is a clear move below the $42,500 support zone.
Bitcoin Price Corrects Gains
Bitcoin price attempted an upside break above the $45,500 resistance zone. However, BTC struggled to gain pace above the $45,500 level. A high was formed near $45,900 and the price started a fresh decline.
The price moved below the $45,000 and $44,500 support levels. Besides, there was a break below a key bullish trend line with support near $43,500 on the hourly chart of the BTC/USD pair. The pair is now trading below $43,500 and the 100 hourly simple moving average.
Bitcoin is now finding bids near the $42,600 level. A low is formed near $42,664 and the price is now consolidating losses. An immediate resistance is near the $43,450 level. It is near the 23.6% Fib retracement level of the recent decline from the $45,900 high to $42,664 low.
The first major resistance is near the $44,000 level and the 100 hourly simple moving average. The next key resistance is near the $44,250 level. It is near the 50% Fib retracement level of the recent decline from the $45,900 high to $42,664 low.
Source: BTCUSD on TradingView.com
A clear upside break above the $44,250 level might open the doors for more upsides. The main resistance on the upside is still near the $45,500 level.
More Losses in BTC?
If bitcoin fails to start a fresh increase above $44,250, it could continue to move down. An immediate support on the downside is near the $42,600 zone.
The next major support is seen near the $42,500 level. If there is a downside break below the $42,500 support, the price could start a major decline towards the $41,200 level.
Technical indicators:
Hourly MACD – The MACD is now gaining pace in the bearish zone.
Hourly RSI (Relative Strength Index) – The RSI for BTC/USD is now below the 50 level.
Major Support Levels – $42,500, followed by $41,200.
Major Resistance Levels – $44,000, $44,250 and $45,500.
Bitcoin failed again to clear the $45,500 resistance zone against the US Dollar. BTC is declining and remains at a risk of more losses below $42,500.
Bitcoin attempted another upside break above $45,500 but failed.
The price is trading below $43,500 and the 100 hourly simple moving average.
There was a break below a key bullish trend line with support near $43,500 on the hourly chart of the BTC/USD pair (data feed from Kraken).
The pair could decline sharply if there is a clear move below the $42,500 support zone.
Bitcoin price attempted an upside break above the $45,500 resistance zone. However, BTC struggled to gain pace above the $45,500 level. A high was formed near $45,900 and the price started a fresh decline.
The price moved below the $45,000 and $44,500 support levels. Besides, there was a break below a key bullish trend line with support near $43,500 on the hourly chart of the BTC/USD pair. The pair is now trading below $43,500 and the 100 hourly simple moving average.
Bitcoin is now finding bids near the $42,600 level. A low is formed near $42,664 and the price is now consolidating losses. An immediate resistance is near the $43,450 level. It is near the 23.6% Fib retracement level of the recent decline from the $45,900 high to $42,664 low.
The first major resistance is near the $44,000 level and the 100 hourly simple moving average. The next key resistance is near the $44,250 level. It is near the 50% Fib retracement level of the recent decline from the $45,900 high to $42,664 low.
Source: BTCUSD on TradingView.com
A clear upside break above the $44,250 level might open the doors for more upsides. The main resistance on the upside is still near the $45,500 level.
If bitcoin fails to start a fresh increase above $44,250, it could continue to move down. An immediate support on the downside is near the $42,600 zone.
The next major support is seen near the $42,500 level. If there is a downside break below the $42,500 support, the price could start a major decline towards the $41,200 level.
Technical indicators:
Hourly MACD – The MACD is now gaining pace in the bearish zone.
Hourly RSI (Relative Strength Index) – The RSI for BTC/USD is now below the 50 level.
Major Support Levels – $42,500, followed by $41,200.
Major Resistance Levels – $44,000, $44,250 and $45,500.
Tags: bitcoinbtcusdBTCUSDTxbtusd
FeedzyRead More
Crypto analyst Blade has pointed to a Bitcoin trend that could signal when the leading…
Bitcoin and software equities have sharply diverged after moving in lockstep for years, raising questions…
Bitcoin and ether fell Monday after dropping in May, a month that usually sees them…
U.S. spot bitcoin ETFs lost $2.97 billion across 10 trading days through Friday, the longest…
Bitcoin price started a fresh decline below the $73,800 zone. BTC is consolidating and might…
The creator of the Mayer Multiple argues bitcoin’s growing economic substance is compressing volatility and…