Bitcoin failed again to clear the $45,500 resistance zone against the US Dollar. BTC is declining and remains at a risk of more losses below $42,500.
Bitcoin attempted another upside break above $45,500 but failed.
The price is trading below $43,500 and the 100 hourly simple moving average.
There was a break below a key bullish trend line with support near $43,500 on the hourly chart of the BTC/USD pair (data feed from Kraken).
The pair could decline sharply if there is a clear move below the $42,500 support zone.
Bitcoin Price Corrects Gains
Bitcoin price attempted an upside break above the $45,500 resistance zone. However, BTC struggled to gain pace above the $45,500 level. A high was formed near $45,900 and the price started a fresh decline.
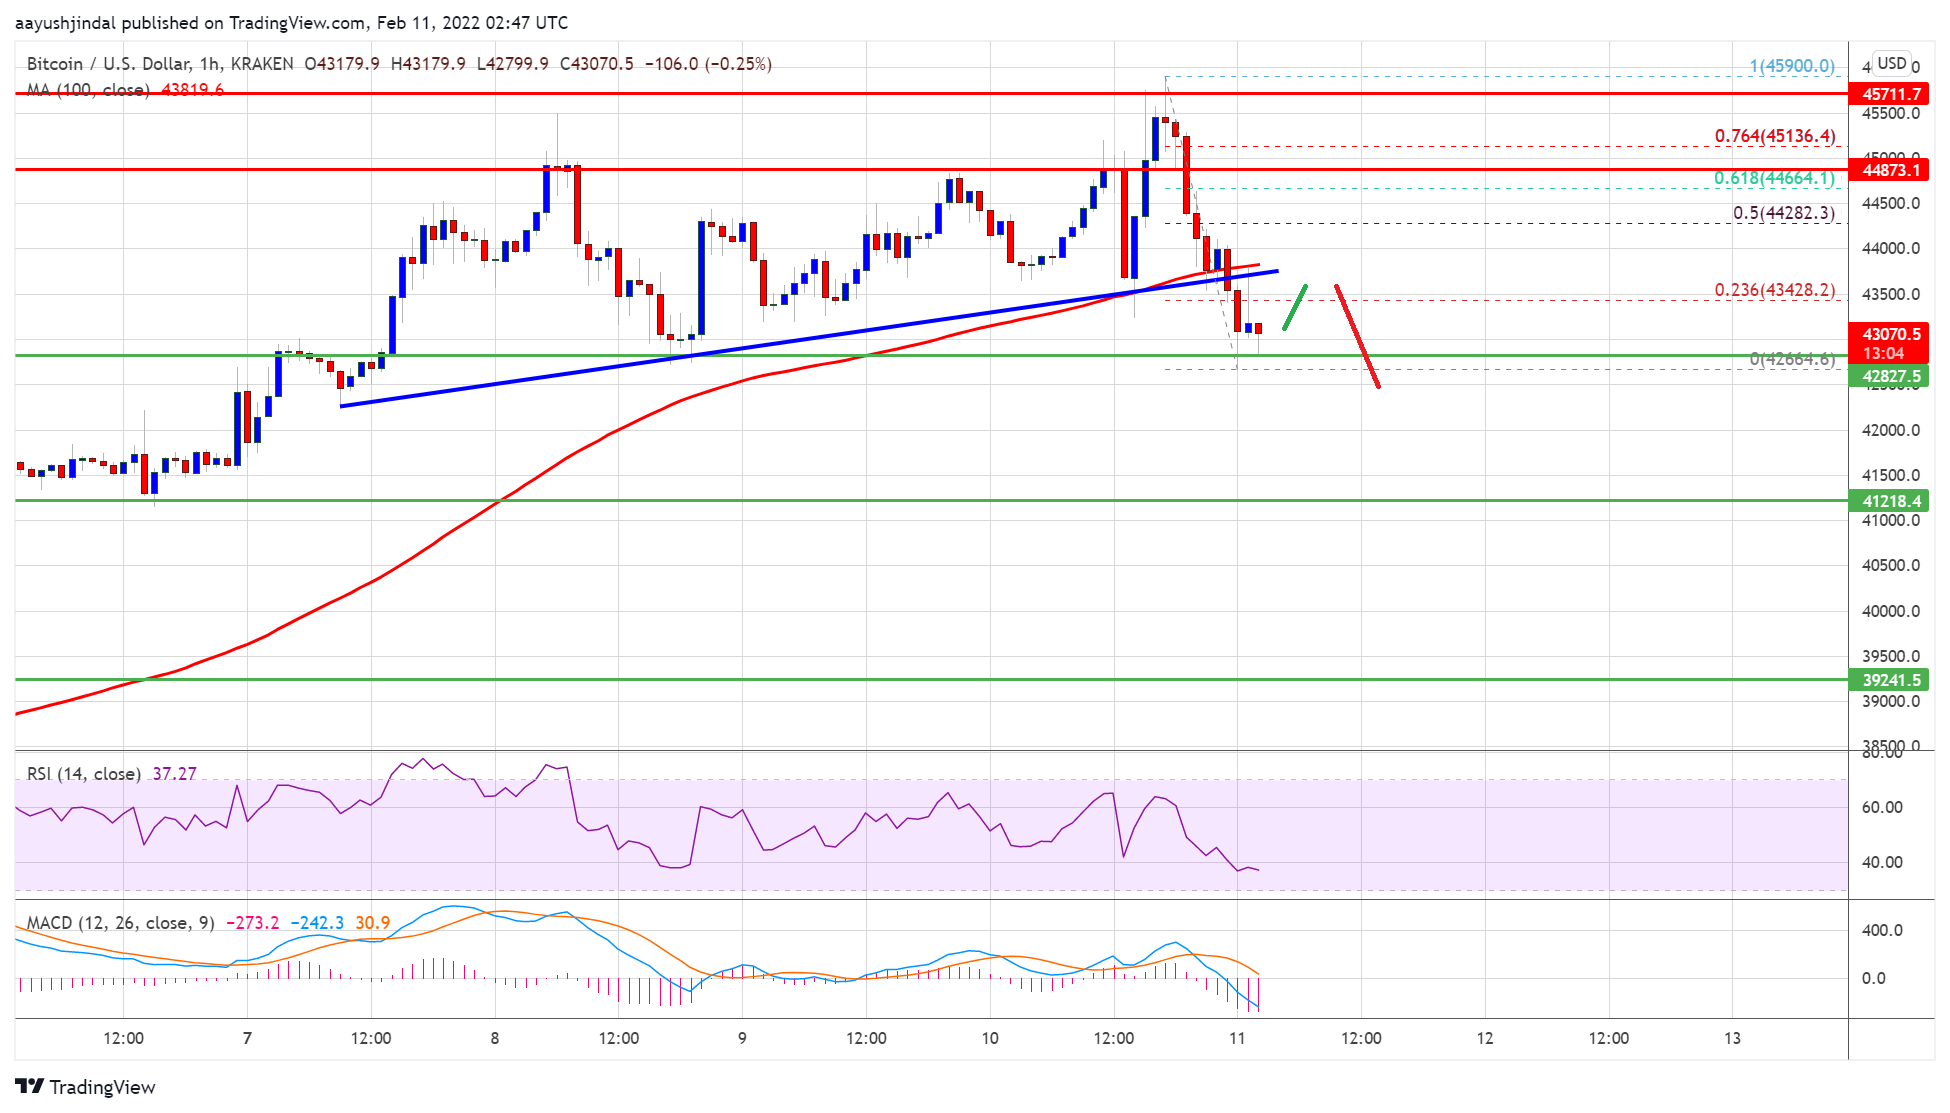
The price moved below the $45,000 and $44,500 support levels. Besides, there was a break below a key bullish trend line with support near $43,500 on the hourly chart of the BTC/USD pair. The pair is now trading below $43,500 and the 100 hourly simple moving average.
Bitcoin is now finding bids near the $42,600 level. A low is formed near $42,664 and the price is now consolidating losses. An immediate resistance is near the $43,450 level. It is near the 23.6% Fib retracement level of the recent decline from the $45,900 high to $42,664 low.
The first major resistance is near the $44,000 level and the 100 hourly simple moving average. The next key resistance is near the $44,250 level. It is near the 50% Fib retracement level of the recent decline from the $45,900 high to $42,664 low.
Source: BTCUSD on TradingView.com
A clear upside break above the $44,250 level might open the doors for more upsides. The main resistance on the upside is still near the $45,500 level.
More Losses in BTC?
If bitcoin fails to start a fresh increase above $44,250, it could continue to move down. An immediate support on the downside is near the $42,600 zone.
The next major support is seen near the $42,500 level. If there is a downside break below the $42,500 support, the price could start a major decline towards the $41,200 level.
Technical indicators:
Hourly MACD – The MACD is now gaining pace in the bearish zone.
Hourly RSI (Relative Strength Index) – The RSI for BTC/USD is now below the 50 level.
Major Support Levels – $42,500, followed by $41,200.
Major Resistance Levels – $44,000, $44,250 and $45,500.
Bitcoin failed again to clear the $45,500 resistance zone against the US Dollar. BTC is declining and remains at a risk of more losses below $42,500.
Bitcoin attempted another upside break above $45,500 but failed.
The price is trading below $43,500 and the 100 hourly simple moving average.
There was a break below a key bullish trend line with support near $43,500 on the hourly chart of the BTC/USD pair (data feed from Kraken).
The pair could decline sharply if there is a clear move below the $42,500 support zone.
Bitcoin price attempted an upside break above the $45,500 resistance zone. However, BTC struggled to gain pace above the $45,500 level. A high was formed near $45,900 and the price started a fresh decline.
The price moved below the $45,000 and $44,500 support levels. Besides, there was a break below a key bullish trend line with support near $43,500 on the hourly chart of the BTC/USD pair. The pair is now trading below $43,500 and the 100 hourly simple moving average.
Bitcoin is now finding bids near the $42,600 level. A low is formed near $42,664 and the price is now consolidating losses. An immediate resistance is near the $43,450 level. It is near the 23.6% Fib retracement level of the recent decline from the $45,900 high to $42,664 low.
The first major resistance is near the $44,000 level and the 100 hourly simple moving average. The next key resistance is near the $44,250 level. It is near the 50% Fib retracement level of the recent decline from the $45,900 high to $42,664 low.
Source: BTCUSD on TradingView.com
A clear upside break above the $44,250 level might open the doors for more upsides. The main resistance on the upside is still near the $45,500 level.
If bitcoin fails to start a fresh increase above $44,250, it could continue to move down. An immediate support on the downside is near the $42,600 zone.
The next major support is seen near the $42,500 level. If there is a downside break below the $42,500 support, the price could start a major decline towards the $41,200 level.
Technical indicators:
Hourly MACD – The MACD is now gaining pace in the bearish zone.
Hourly RSI (Relative Strength Index) – The RSI for BTC/USD is now below the 50 level.
Major Support Levels – $42,500, followed by $41,200.
Major Resistance Levels – $44,000, $44,250 and $45,500.
Tags: bitcoinbtcusdBTCUSDTxbtusd
FeedzyRead More
“The wildest thing about my $1 million prediction is that it's not wild at all,”…
Wall Street broker Bernstein took note of an institutional ownership shift as behind bitcoin's resilience…
Gains came for crypto and stocks as tensions around the Strait of Hormuz appeared to…
Every few years, a chart pattern resurfaces in the Bitcoin market that commands serious attention…
Bitcoin is showing early signs of recovery after firmly holding a major confluence support zone.…
Bitcoin Magazine Metaplanet Raises $255 Million, Eyes $531 Million Bitcoin Buying Spree Tokyo-listed investment firm…