Bitcoin started a strong decline below the $40,000 support against the US Dollar. BTC might recover, but upsides might be limited above $38,000.
Bitcoin started a major decline below the $40,000 and $38,000 support levels.
The price is now trading below $38,000 and the 100 hourly simple moving average.
There is a key bearish trend line with resistance near $36,500 on the hourly chart of the BTC/USD pair (data feed from Kraken).
The pair could continue to move down if there is a break below the $34,000 support.
Bitcoin Price Extends Losses
Bitcoin price started a major decline below the $42,000 and $40,000 support levels. BTC gained pace below the $38,000 level to move further into a bearish zone.
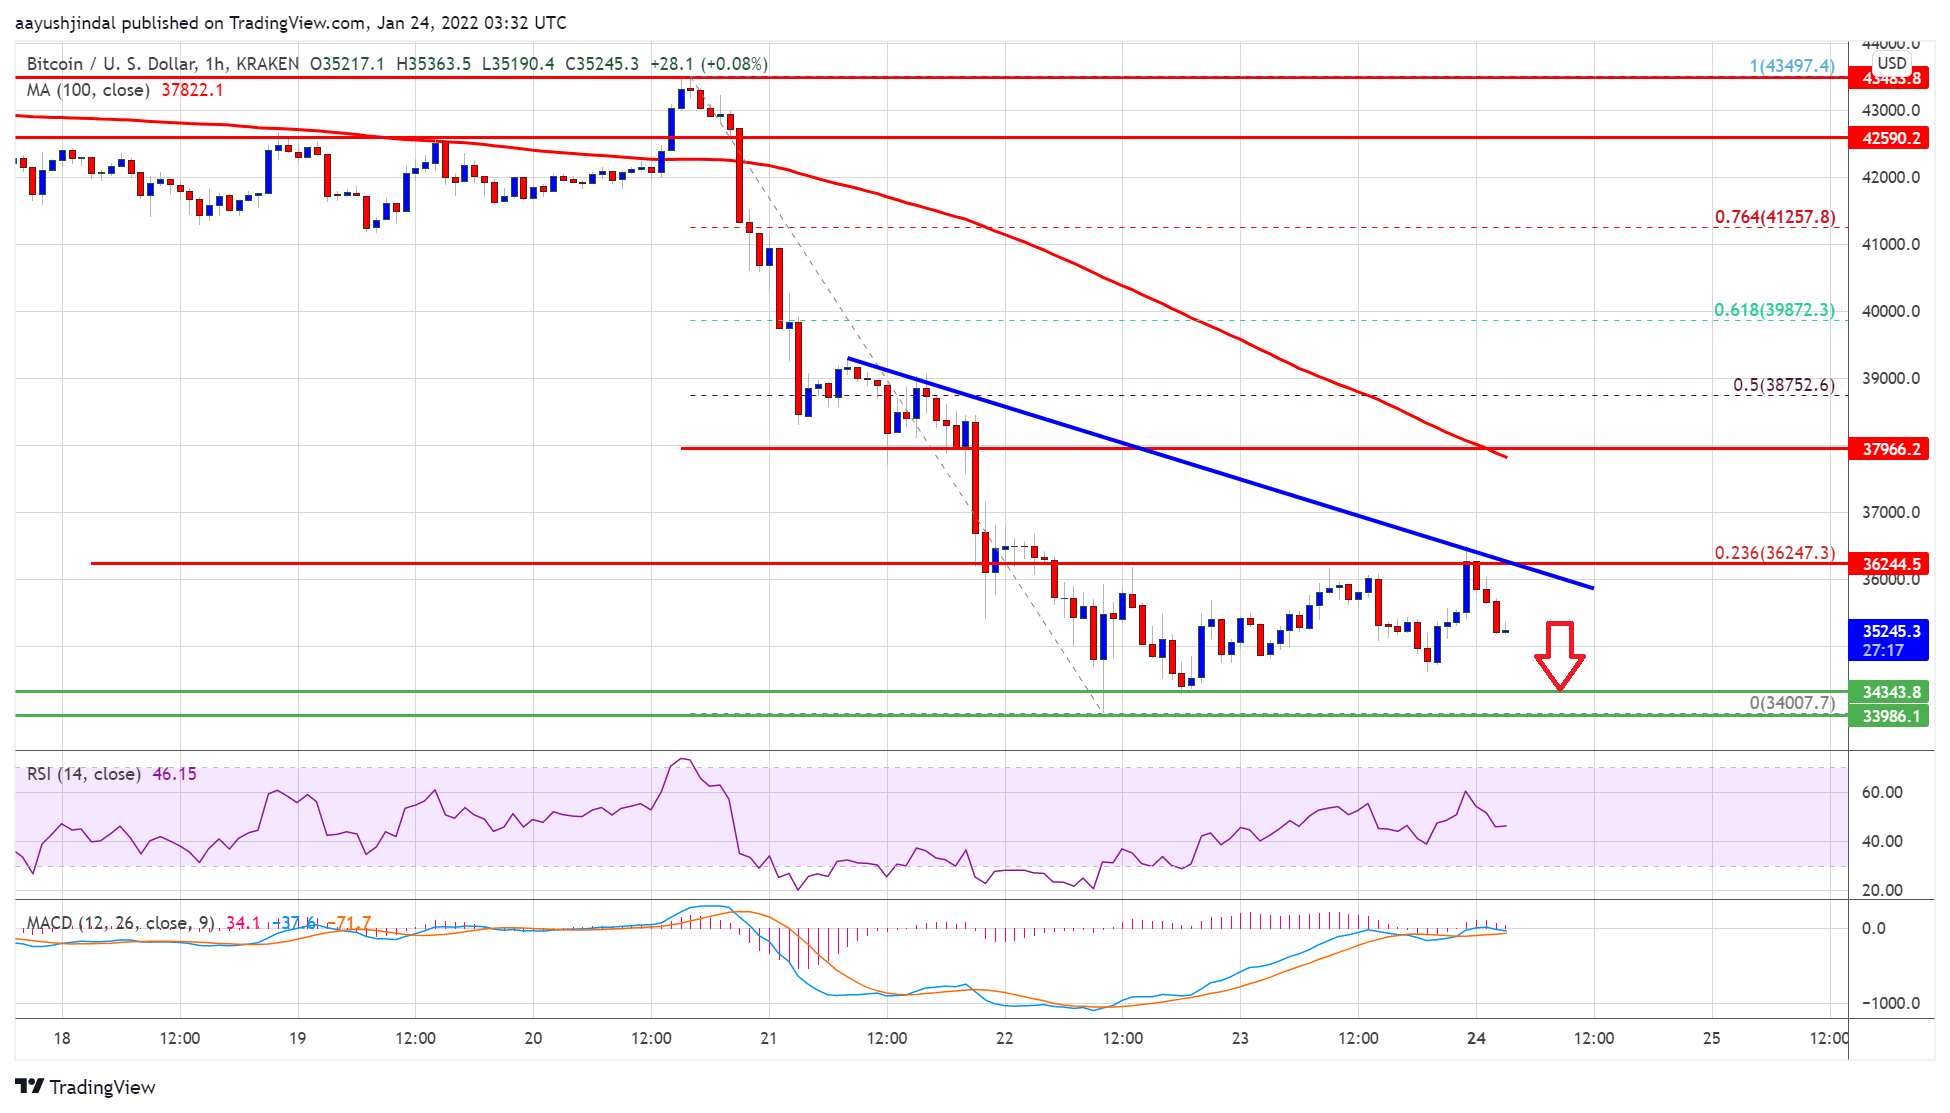
It traded as low as $34,007 and is currently consolidating losses. It is now trading below $38,000 and the 100 hourly simple moving average.
On the upside, an initial resistance is near the $36,200 level. There is also a key bearish trend line with resistance near $36,500 on the hourly chart of the BTC/USD pair. The trend line is near the 23.6% Fib retracement level of the recent decline from the $43,500 swing high to $34,007 low.
The first major resistance is near the $36,800 level. An upside break above the $36,800 resistance could start a steady recovery wave towards $38,000. The next key resistance is near the $40,000 level, above which the bulls might aim a test of $41,200.
Source: BTCUSD on TradingView.com
An intermediate resistance is near the 50% Fib retracement level of the recent decline from the $43,500 swing high to $34,007 low. Any more gains may perhaps call for a move towards the $42,500 resistance zone.
More Losses in BTC?
If bitcoin fails to start a fresh increase above $36,500, it could start another decline. An immediate support on the downside is near the $34,500 zone.
The first major support is seen near the $34,000 zone. A downside break below the $34,000 support zone may perhaps spark another major decline. The next major support is near $32,500, below which the price could even decline below the $32,000 zone.
Technical indicators:
Hourly MACD – The MACD is now gaining pace in the bearish zone.
Hourly RSI (Relative Strength Index) – The RSI for BTC/USD is well below the 50 level.
Major Support Levels – $34,500, followed by $34,000.
Major Resistance Levels – $36,250, $36,500 and $38,000.
Bitcoin started a strong decline below the $40,000 support against the US Dollar. BTC might recover, but upsides might be limited above $38,000.
Bitcoin started a major decline below the $40,000 and $38,000 support levels.
The price is now trading below $38,000 and the 100 hourly simple moving average.
There is a key bearish trend line with resistance near $36,500 on the hourly chart of the BTC/USD pair (data feed from Kraken).
The pair could continue to move down if there is a break below the $34,000 support.
Bitcoin price started a major decline below the $42,000 and $40,000 support levels. BTC gained pace below the $38,000 level to move further into a bearish zone.
It traded as low as $34,007 and is currently consolidating losses. It is now trading below $38,000 and the 100 hourly simple moving average.
On the upside, an initial resistance is near the $36,200 level. There is also a key bearish trend line with resistance near $36,500 on the hourly chart of the BTC/USD pair. The trend line is near the 23.6% Fib retracement level of the recent decline from the $43,500 swing high to $34,007 low.
The first major resistance is near the $36,800 level. An upside break above the $36,800 resistance could start a steady recovery wave towards $38,000. The next key resistance is near the $40,000 level, above which the bulls might aim a test of $41,200.
Source: BTCUSD on TradingView.com
An intermediate resistance is near the 50% Fib retracement level of the recent decline from the $43,500 swing high to $34,007 low. Any more gains may perhaps call for a move towards the $42,500 resistance zone.
If bitcoin fails to start a fresh increase above $36,500, it could start another decline. An immediate support on the downside is near the $34,500 zone.
The first major support is seen near the $34,000 zone. A downside break below the $34,000 support zone may perhaps spark another major decline. The next major support is near $32,500, below which the price could even decline below the $32,000 zone.
Technical indicators:
Hourly MACD – The MACD is now gaining pace in the bearish zone.
Hourly RSI (Relative Strength Index) – The RSI for BTC/USD is well below the 50 level.
Major Support Levels – $34,500, followed by $34,000.
Major Resistance Levels – $36,250, $36,500 and $38,000.
Tags: bitcoinbtcusdBTCUSDTxbtusd
FeedzyRead More
On-chain analytics firm Glassnode has explained how a flip in Bitcoin short-term holder profitability could…
A crypto analyst is calling for a $40,000 Bitcoin price surge within 60 days, and…
As Bitcoin (BTC) seeks to solidify its position around $71,000, the cryptocurrency faces a challenge…
Bitcoin and crypto exchanges built much of the cryptocurrency industry’s reputation by challenging traditional finance.…
Bitcoin Magazine AI Pivot Won’t Save Everyone, Wintermute Tells Bitcoin Miners Bitcoin miners are caught…
Bitcoin Magazine South African Eskom Considering Discount Power for Bitcoin Miners as Solar Creates Surplus…