Bitcoin extended decline and traded below $29,000 against the US Dollar. BTC must stay above the $28,500 level to avoid a sharp decline in the near term.
Bitcoin started a fresh decline from the $30,500 resistance zone.
The price is now trading below the $30,000 level and the 100 hourly simple moving average.
There was a break below a connecting bullish trend line with support near $29,600 on the hourly chart of the BTC/USD pair (data feed from Kraken).
The pair could extend decline if there is a clear move below the $28,500 support zone.
Bitcoin Price Is Showing Bearish Signs
Bitcoin price failed to clear the $30,500 resistance zone and started a fresh increase. There was a clear move below the $29,500 and $29,000 support levels.
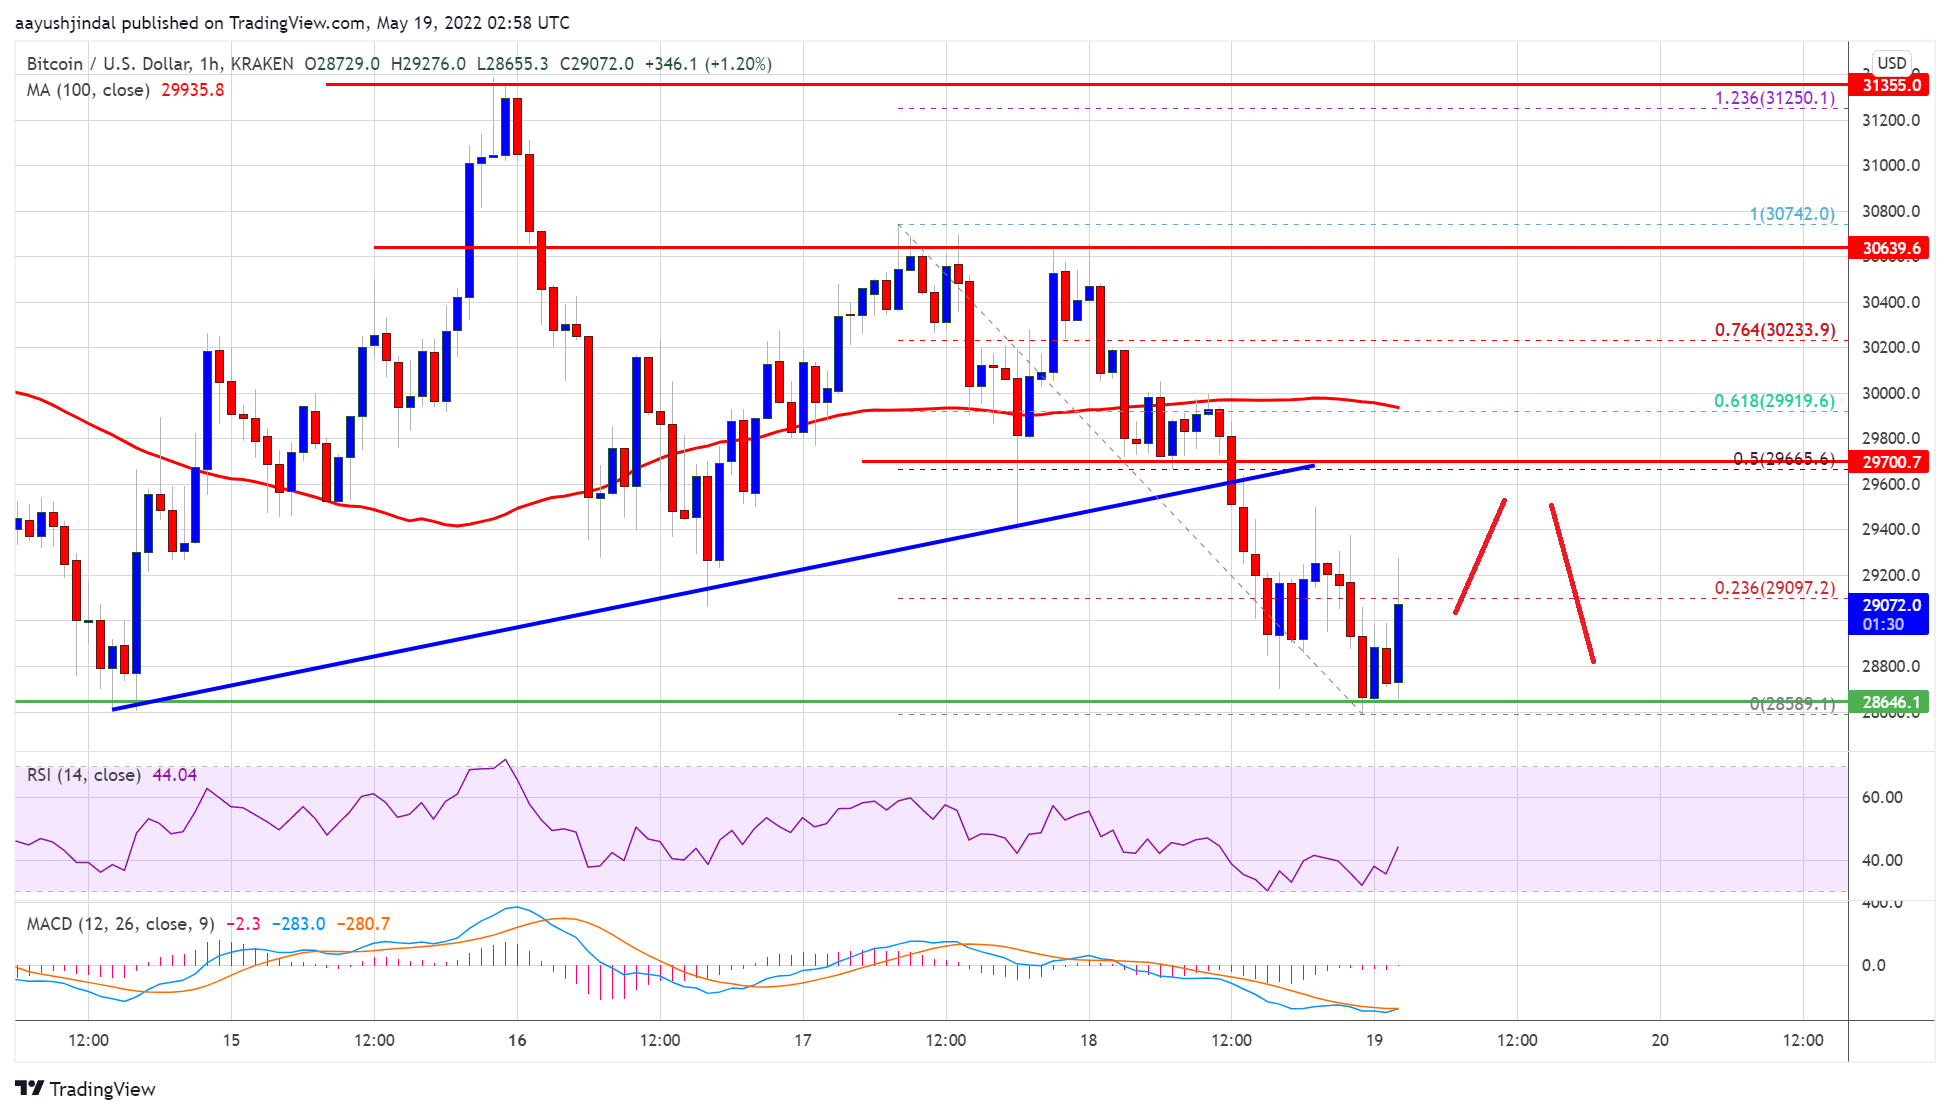
Besides, there was a break below a connecting bullish trend line with support near $29,600 on the hourly chart of the BTC/USD pair. The pair is now trading below $30,000 and the 100 hourly simple moving average. It tested the $28,500 support zone.
A low is formed near $28,589 and the price is now consolidating losses. An immediate resistance is near the $29,100 level. It is near the 23.6% Fib retracement level of the recent decline from the $30,742 swing high to $28,589 low.
Source: BTCUSD on TradingView.com
The next major resistance is near the $29,650 level. It is near the 50 Fib retracement level of the recent decline from the $30,742 swing high to $28,589 low. A clear move above the $29,500 and $29,650 resistance levels might start a fresh increase in the near term. The next key resistance could be near the $30,500 level, above which the price might rise towards $31,200.
More Losses in BTC?
If bitcoin fails to gain pace above the $29,650 resistance zone, it could continue to move down. An immediate support on the downside is near the $28,800 level.
The next major support is near the $28,500 level. A downside break and close below the $28,500 support might start a major decline. In the stated case, the price could drop towards the $27,500 level.
Technical indicators:
Hourly MACD – The MACD is now slowly losing pace in the bearish zone.
Hourly RSI (Relative Strength Index) – The RSI for BTC/USD is now below the 50 level.
Major Support Levels – $28,800, followed by $28,500.
Major Resistance Levels – $29,650, $30,000 and $30,500.
Bitcoin extended decline and traded below $29,000 against the US Dollar. BTC must stay above the $28,500 level to avoid a sharp decline in the near term.
Bitcoin started a fresh decline from the $30,500 resistance zone.
The price is now trading below the $30,000 level and the 100 hourly simple moving average.
There was a break below a connecting bullish trend line with support near $29,600 on the hourly chart of the BTC/USD pair (data feed from Kraken).
The pair could extend decline if there is a clear move below the $28,500 support zone.
Bitcoin price failed to clear the $30,500 resistance zone and started a fresh increase. There was a clear move below the $29,500 and $29,000 support levels.
Besides, there was a break below a connecting bullish trend line with support near $29,600 on the hourly chart of the BTC/USD pair. The pair is now trading below $30,000 and the 100 hourly simple moving average. It tested the $28,500 support zone.
A low is formed near $28,589 and the price is now consolidating losses. An immediate resistance is near the $29,100 level. It is near the 23.6% Fib retracement level of the recent decline from the $30,742 swing high to $28,589 low.
Source: BTCUSD on TradingView.com
The next major resistance is near the $29,650 level. It is near the 50 Fib retracement level of the recent decline from the $30,742 swing high to $28,589 low. A clear move above the $29,500 and $29,650 resistance levels might start a fresh increase in the near term. The next key resistance could be near the $30,500 level, above which the price might rise towards $31,200.
If bitcoin fails to gain pace above the $29,650 resistance zone, it could continue to move down. An immediate support on the downside is near the $28,800 level.
The next major support is near the $28,500 level. A downside break and close below the $28,500 support might start a major decline. In the stated case, the price could drop towards the $27,500 level.
Technical indicators:
Hourly MACD – The MACD is now slowly losing pace in the bearish zone.
Hourly RSI (Relative Strength Index) – The RSI for BTC/USD is now below the 50 level.
Major Support Levels – $28,800, followed by $28,500.
Major Resistance Levels – $29,650, $30,000 and $30,500.
Tags: bitcoinbtcusdBTCUSDTxbtusd
FeedzyRead More
Bitcoin price started a recovery wave above $68,500. BTC is now struggling to clear $72,000…
Bitcoin’s latest drawdown from its all-time high is being compared to 2022 across crypto Twitter…
Scaramucci noted that SkyBridge has been purchasing bitcoin at various price points, including around $84,000,…
Bitcoin’s mining landscape is showing clear signs of stress as network difficulty records its largest…
The Bitcoin and Ethereum prices have rebounded from last week’s lows, providing optimism that the…
Bitcoin is tightening between two major liquidity pools, with both bulls and bears sitting on…