Bitcoin struggled above the $21,500 resistance zone against the US Dollar. BTC is trimming gains and might find support near the 100 hourly SMA.
Bitcoin climbed above the $21,500 level before it faced sellers.
The price is now above the $20,000 level and the 100 hourly simple moving average.
There was a break below a key bullish trend line with support near $21,175 on the hourly chart of the BTC/USD pair (data feed from Kraken).
The pair could find bids near the $20,000 zone or the 100 hourly simple moving average.
Bitcoin Price Dips
Bitcoin price started an upside correction above the $20,000 resistance zone. There was a decent recovery wave above the $20,200 and $20,500 levels.
Download Bitcoin Miner Awesom Miner Official for Windows. Safe install and earn BTC.
The price climbed the 61.8% Fib retracement level of the key downside from the $22,950 high to $17,600 low. Finally, there was a move above the $21,000 resistance zone and the price settled above the 100 hourly simple moving average.
However, the bears were active above the $21,500 level. A high was formed near the $21,698 and the price started a downside correction.
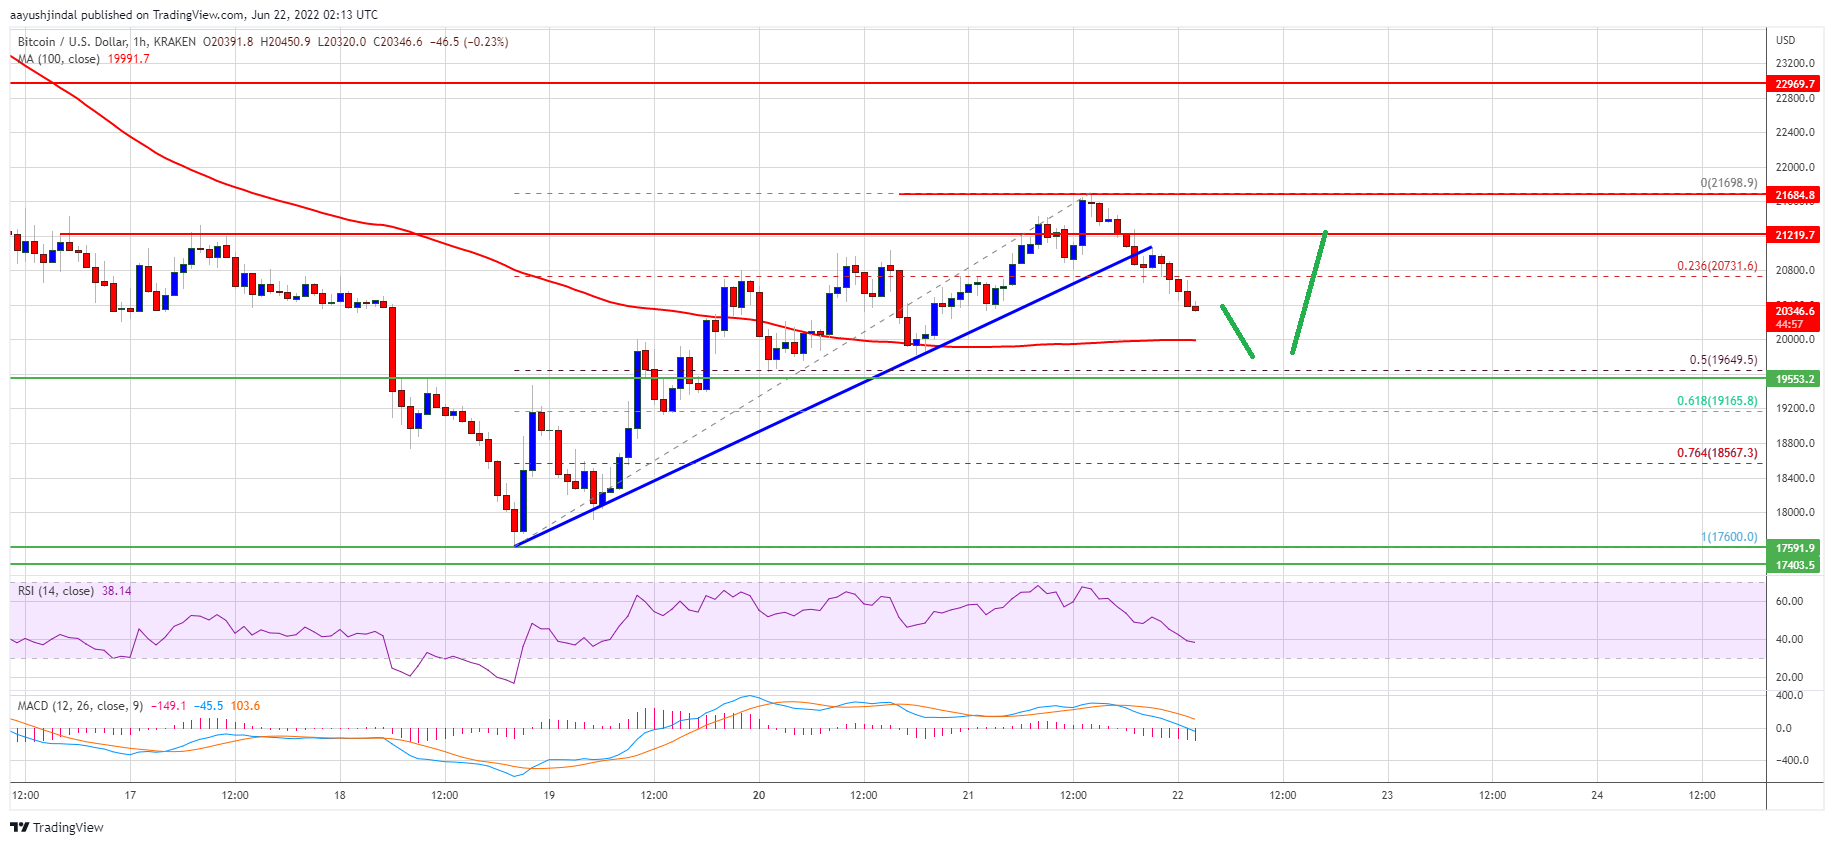
There was a break below the 23.6% Fib retracement level of the upward move from the $17,600 swing low to $21,698 high. Besides, there was a break below a key bullish trend line with support near $21,175 on the hourly chart of the BTC/USD pair.
The price is now trading below $21,000. An immediate resistance on the upside is near the $20,550 level. The first major resistance is near the $21,000 and $21,220 levels.
Source: BTCUSD on TradingView.com
A clear move above the $21,220 level might call for a move to $21,700. Any more gains might send the price towards the $22,200 level in the coming sessions.
More Losses in BTC?
If bitcoin fails to clear the $21,220 resistance zone, it could continue to move down. An immediate support on the downside is near the $20,000 level and the 100 hourly SMA.
The next major support is near the $19,650 level. It is near the 50% Fib retracement level of the upward move from the $17,600 swing low to $21,698 high. A downside break below the $19,650 support could restart downtrend in the near term.
Technical indicators:
Hourly MACD – The MACD is now gaining pace in the bearish zone.
Hourly RSI (Relative Strength Index) – The RSI for BTC/USD is now below the 50 level.
Major Support Levels – $20,000, followed by $19,650.
Major Resistance Levels – $20,500, $21,220 and $21,700.
Bitcoin struggled above the $21,500 resistance zone against the US Dollar. BTC is trimming gains and might find support near the 100 hourly SMA.
Bitcoin climbed above the $21,500 level before it faced sellers.
The price is now above the $20,000 level and the 100 hourly simple moving average.
There was a break below a key bullish trend line with support near $21,175 on the hourly chart of the BTC/USD pair (data feed from Kraken).
The pair could find bids near the $20,000 zone or the 100 hourly simple moving average.
Bitcoin price started an upside correction above the $20,000 resistance zone. There was a decent recovery wave above the $20,200 and $20,500 levels.
The price climbed the 61.8% Fib retracement level of the key downside from the $22,950 high to $17,600 low. Finally, there was a move above the $21,000 resistance zone and the price settled above the 100 hourly simple moving average.
However, the bears were active above the $21,500 level. A high was formed near the $21,698 and the price started a downside correction.
There was a break below the 23.6% Fib retracement level of the upward move from the $17,600 swing low to $21,698 high. Besides, there was a break below a key bullish trend line with support near $21,175 on the hourly chart of the BTC/USD pair.
The price is now trading below $21,000. An immediate resistance on the upside is near the $20,550 level. The first major resistance is near the $21,000 and $21,220 levels.
Source: BTCUSD on TradingView.com
A clear move above the $21,220 level might call for a move to $21,700. Any more gains might send the price towards the $22,200 level in the coming sessions.
If bitcoin fails to clear the $21,220 resistance zone, it could continue to move down. An immediate support on the downside is near the $20,000 level and the 100 hourly SMA.
The next major support is near the $19,650 level. It is near the 50% Fib retracement level of the upward move from the $17,600 swing low to $21,698 high. A downside break below the $19,650 support could restart downtrend in the near term.
Technical indicators:
Hourly MACD – The MACD is now gaining pace in the bearish zone.
Hourly RSI (Relative Strength Index) – The RSI for BTC/USD is now below the 50 level.
Major Support Levels – $20,000, followed by $19,650.
Major Resistance Levels – $20,500, $21,220 and $21,700.
Tags: bitcoinbtcusdBTCUSDTxbtusd
FeedzyRead More
A tiny Strategy sale raised a bigger question about Saylor’s never-sell stance, while easing Iran…
TL;DR Aave Labs has proposed onboarding Circle Wrapped Bitcoin, or cirBTC, to Aave V3 Core…
Bitcoin Magazine Standard Chartered Calls Crypto Bottom as Bitcoin Price Recovers From $59,000 Low Standard…
Senior market analyst Geoffrey Kendrick pointed to the SpaceX IPO and a potential U.S.-Iran peace…
Bitcoin ETF investors have pulled billions this year, but the broader crypto ETF market remains…
Bitcoin Magazine SpaceX Officially Joins Public Bitcoin Leaderboard as 8th Largest Holder With 18,712 BTC…