Bitcoin extended gains above $42,500 against the US Dollar. BTC struggled near $43,000 and started a sharp downside correction.
Bitcoin started another decline after it failed to clear the $43,000 resistance zone.
The price is now trading below $41,000 and the 100 hourly simple moving average.
There was a break below a major bullish trend line with support near $41,250 on the hourly chart of the BTC/USD pair (data feed from Kraken).
The pair could attempt a fresh increase, but the $41,000 resistance holds the key.
Bitcoin Price Dips
Bitcoin price remained well bid above the $41,500 resistance zone. BTC gained pace and cleared the $42,000 resistance zone. It even moved above $42,500 and the 100 hourly simple moving average.
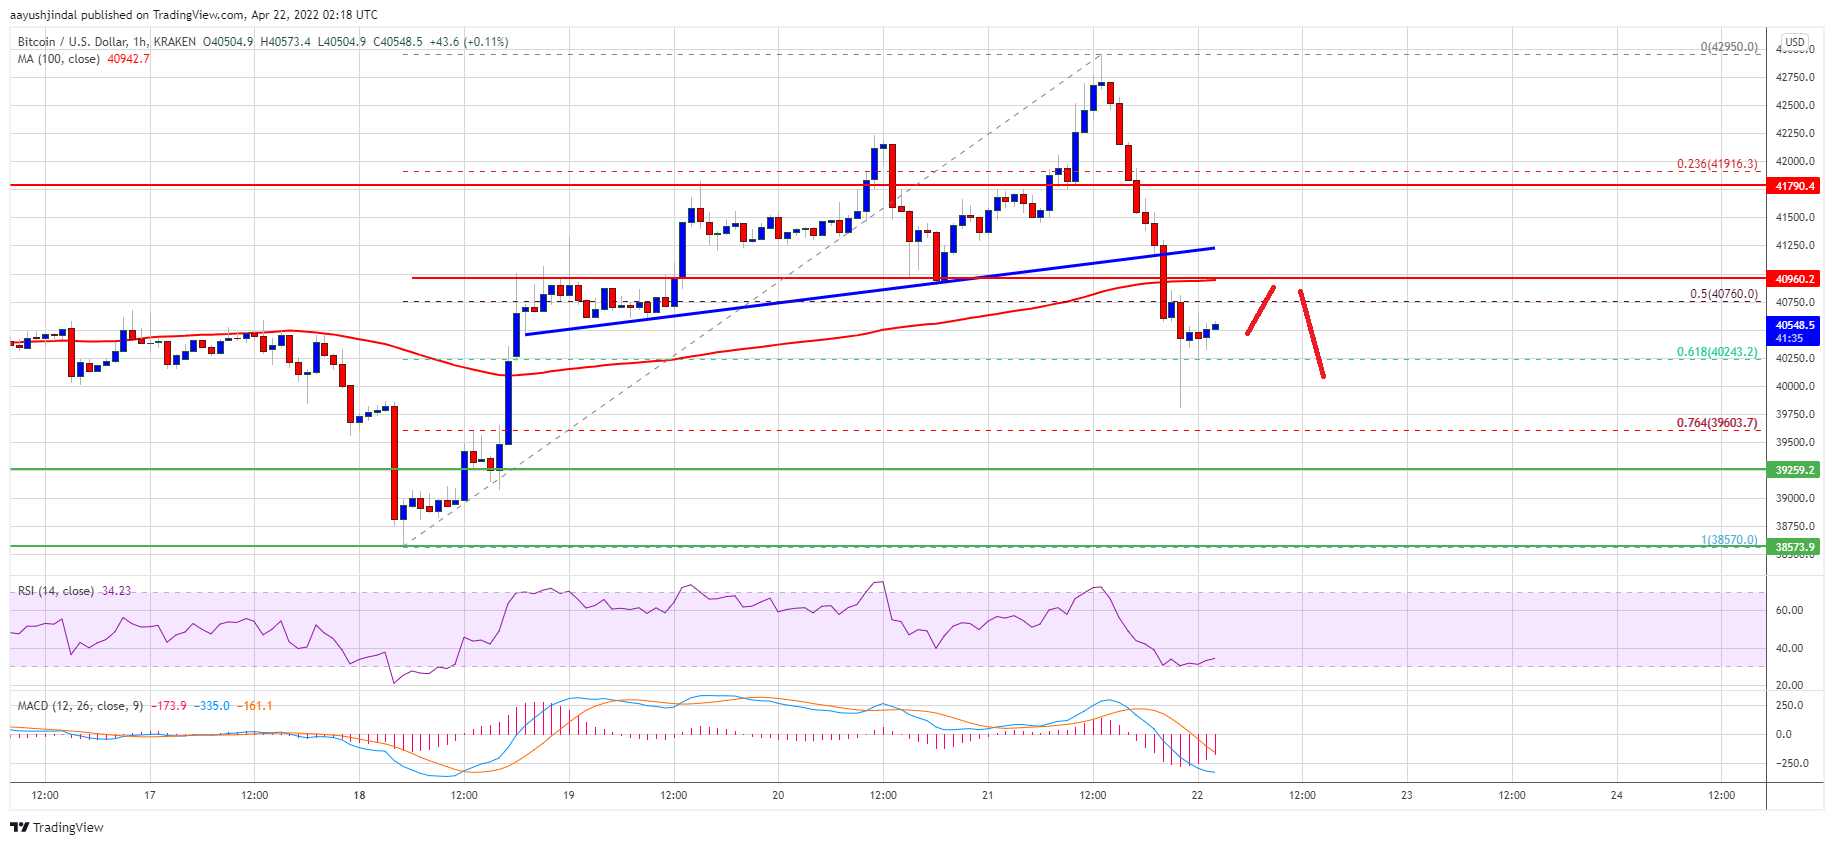
However, the bulls failed to push the price above the $43,000 level. A high was formed near $42,950 and the price reacted to the downside. There was a sharp move below the $42,000 level. Besides, there was a break below a major bullish trend line with support near $41,250 on the hourly chart of the BTC/USD pair.
There was a break below the 50% Fib retracement level of the upward move from the $38,750 swing low to $42,950 high. Bitcoin is now trading below $41,000 and the 100 hourly simple moving average.
The price is now consolidating above the 61.8% Fib retracement level of the upward move from the $38,750 swing low to $42,950 high. An immediate resistance on the upside is near the $40,750 level. The next key resistance could be $40,950 and the 100 hourly simple moving average.
Source: BTCUSD on TradingView.com
To start a strong upward move, the price must settle above the $41,000 zone and the 100 hourly simple moving average. If the bulls succeed, the price could rise towards the $41,800 resistance zone.
More Losses in BTC?
If bitcoin fails to clear the $41,000 resistance zone, it could continue to move down. An immediate support on the downside is near the $40,250 level.
The next major support is seen near the $40,000 level. A downside break below the $40,000 zone could send the price towards the $39,250 support zone.
Technical indicators:
Hourly MACD – The MACD is slowly losing pace in the bearish zone.
Hourly RSI (Relative Strength Index) – The RSI for BTC/USD is now below the 50 level.
Major Support Levels – $40,250, followed by $40,000.
Major Resistance Levels – $40,750, $41,000 and $41,800.
Bitcoin extended gains above $42,500 against the US Dollar. BTC struggled near $43,000 and started a sharp downside correction.
Bitcoin started another decline after it failed to clear the $43,000 resistance zone.
The price is now trading below $41,000 and the 100 hourly simple moving average.
There was a break below a major bullish trend line with support near $41,250 on the hourly chart of the BTC/USD pair (data feed from Kraken).
The pair could attempt a fresh increase, but the $41,000 resistance holds the key.
Bitcoin price remained well bid above the $41,500 resistance zone. BTC gained pace and cleared the $42,000 resistance zone. It even moved above $42,500 and the 100 hourly simple moving average.
However, the bulls failed to push the price above the $43,000 level. A high was formed near $42,950 and the price reacted to the downside. There was a sharp move below the $42,000 level. Besides, there was a break below a major bullish trend line with support near $41,250 on the hourly chart of the BTC/USD pair.
There was a break below the 50% Fib retracement level of the upward move from the $38,750 swing low to $42,950 high. Bitcoin is now trading below $41,000 and the 100 hourly simple moving average.
The price is now consolidating above the 61.8% Fib retracement level of the upward move from the $38,750 swing low to $42,950 high. An immediate resistance on the upside is near the $40,750 level. The next key resistance could be $40,950 and the 100 hourly simple moving average.
Source: BTCUSD on TradingView.com
To start a strong upward move, the price must settle above the $41,000 zone and the 100 hourly simple moving average. If the bulls succeed, the price could rise towards the $41,800 resistance zone.
If bitcoin fails to clear the $41,000 resistance zone, it could continue to move down. An immediate support on the downside is near the $40,250 level.
The next major support is seen near the $40,000 level. A downside break below the $40,000 zone could send the price towards the $39,250 support zone.
Technical indicators:
Hourly MACD – The MACD is slowly losing pace in the bearish zone.
Hourly RSI (Relative Strength Index) – The RSI for BTC/USD is now below the 50 level.
Major Support Levels – $40,250, followed by $40,000.
Major Resistance Levels – $40,750, $41,000 and $41,800.
Tags: bitcoinbtcusdBTCUSDTxbtusd
FeedzyRead More
Majors posted broad gains on Monday as oil eased from highs, two tankers sailed through…
Volume jumped more than 250% during the move, with traders watching whether former resistance now…
Bitcoin's convincing move above its key average indicates a strengthening of the bullish momentum.Read MoreCoinDesk:…
Bitcoin price started a steady increase above the $72,000 zone. BTC is now consolidating and…
The crypto market’s fear gauge hit 15 — deep inside “Extreme Fear” territory — yet…
Bitcoin is outperforming equities and gold since the Middle East conflict began, as institutional inflows…