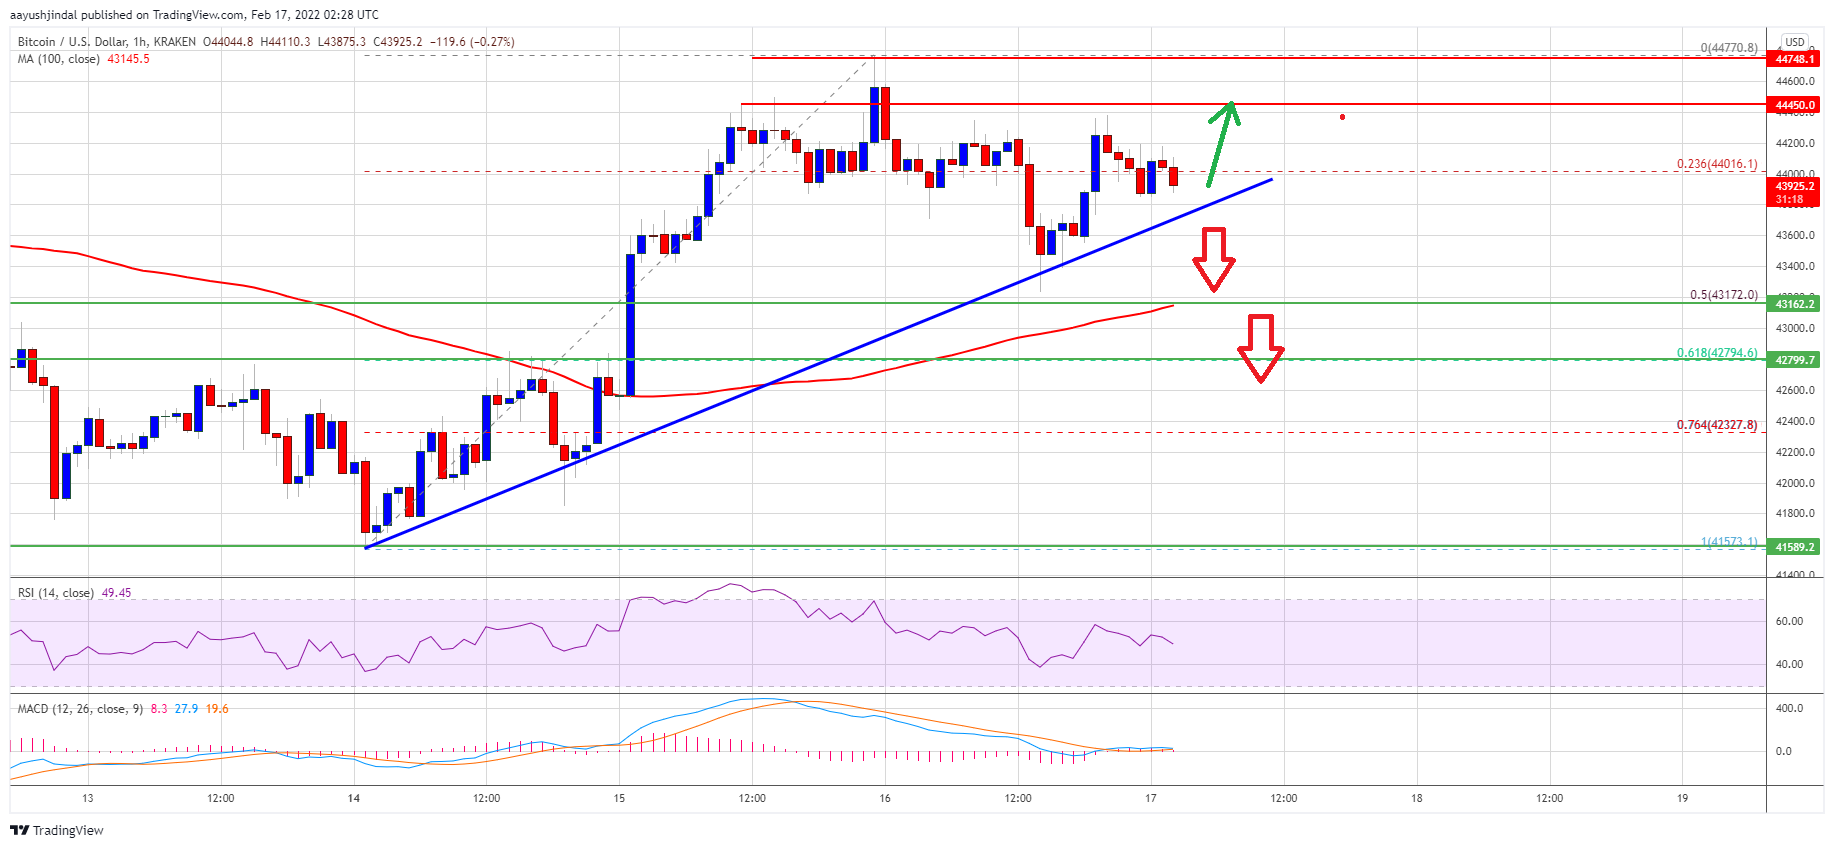
Bitcoin is struggling below the $45,000 resistance against the US Dollar. BTC must stay above $43,180 to avoid a sharp decline in the near term.
Bitcoin is showing a few bearish signs below $45,000 and $44,500.
The price is trading above $43,500 and the 100 hourly simple moving average.
There is a key bullish trend line forming with support near $43,800 on the hourly chart of the BTC/USD pair (data feed from Kraken).
The pair could gain bearish momentum if there is a clear move below $43,180.
Bitcoin Price Stuck Below $45K
Bitcoin price failed to test the $45,000 resistance and started a downside correction. BTC declined below the $44,000 support level to move into a short-term consolidation phase.
There was a break below the 23.6% Fib retracement level of the upward move from the $41,574 swing low to $44,770 high. However, the price is still trading above $43,500 and the 100 hourly simple moving average. There is also a key bullish trend line forming with support near $43,800 on the hourly chart of the BTC/USD pair.
Recently, the price dipped below the $43,250 level, but it was supported above the $43,000 level. Bitcoin is now consolidating near the $44,000 level.
Source: BTCUSD on TradingView.com
On the upside, an initial resistance for the bulls is near the $44,450 level. The next key resistance is near the $44,800 level or the $44,700 high. The main resistance is still near $45,000. A clear move above the $45,000 resistance zone might start a decent increase. The next major resistance is near $45,500, above which the price might rise towards the $46,800 level.
More Losses in BTC?
If bitcoin fails to continue higher above the $44,500 resistance zone, it could continue to move down. An immediate support on the downside is near the $43,800 zone and the trend line.
The next major support is seen near the $43,180 level. It is near the 50% Fib retracement level of the upward move from the $41,574 swing low to $44,770 high. If there is a downside break below the $43,180 support zone, the price might gain bearish momentum for a move to $42,400.
Technical indicators:
Hourly MACD – The MACD is now losing pace in the bearish zone.
Hourly RSI (Relative Strength Index) – The RSI for BTC/USD is still above the 50 level.
Major Support Levels – $43,800, followed by $43,180.
Major Resistance Levels – $44,400, $44,800 and $45,000.
Bitcoin is struggling below the $45,000 resistance against the US Dollar. BTC must stay above $43,180 to avoid a sharp decline in the near term.
Bitcoin is showing a few bearish signs below $45,000 and $44,500.
The price is trading above $43,500 and the 100 hourly simple moving average.
There is a key bullish trend line forming with support near $43,800 on the hourly chart of the BTC/USD pair (data feed from Kraken).
The pair could gain bearish momentum if there is a clear move below $43,180.
Bitcoin price failed to test the $45,000 resistance and started a downside correction. BTC declined below the $44,000 support level to move into a short-term consolidation phase.
There was a break below the 23.6% Fib retracement level of the upward move from the $41,574 swing low to $44,770 high. However, the price is still trading above $43,500 and the 100 hourly simple moving average. There is also a key bullish trend line forming with support near $43,800 on the hourly chart of the BTC/USD pair.
Recently, the price dipped below the $43,250 level, but it was supported above the $43,000 level. Bitcoin is now consolidating near the $44,000 level.
Source: BTCUSD on TradingView.com
On the upside, an initial resistance for the bulls is near the $44,450 level. The next key resistance is near the $44,800 level or the $44,700 high. The main resistance is still near $45,000. A clear move above the $45,000 resistance zone might start a decent increase. The next major resistance is near $45,500, above which the price might rise towards the $46,800 level.
If bitcoin fails to continue higher above the $44,500 resistance zone, it could continue to move down. An immediate support on the downside is near the $43,800 zone and the trend line.
The next major support is seen near the $43,180 level. It is near the 50% Fib retracement level of the upward move from the $41,574 swing low to $44,770 high. If there is a downside break below the $43,180 support zone, the price might gain bearish momentum for a move to $42,400.
Technical indicators:
Hourly MACD – The MACD is now losing pace in the bearish zone.
Hourly RSI (Relative Strength Index) – The RSI for BTC/USD is still above the 50 level.
Major Support Levels – $43,800, followed by $43,180.
Major Resistance Levels – $44,400, $44,800 and $45,000.
Tags: bitcoinbtcusdBTCUSDTxbtusd
FeedzyRead More
TL;DR BlackRock says a 1% to 2% Bitcoin allocation can be reasonable in a multi-asset…
A 50% drop from recent highs has pushed the asset into a zone historically labeled…
Bitcoin Magazine Bitcoin Price Crashes Toward $61,000 as Bloodbath Engulfs Crypto Stocks Bitcoin price is…
A strengthening U.S. dollar and the Fed's hawkish turn under new chair Kevin Warsh may…
Precious metals have fallen sharply from their 2025 highs as markets price in Fed rate…
Bitcoin Magazine BlackRock Tells Investors to Put Bitcoin in Their Portfolios BlackRock, the world’s largest…