Bitcoin failed to clear the $52,000 resistance zone against the US Dollar. BTC is started a major decline and traded below the $50,000 support.
Bitcoin made two attempts to clear the $51,800-$52,000 resistance zone but failed.
The price is trading below $50,000 and the 100 hourly simple moving average.
There was a break below a key bullish trend line with support near $51,200 on the hourly chart of the BTC/USD pair (data feed from Kraken).
The pair is declining and could even dive below the $49,500 support zone in the near term.
Bitcoin Price Forms Bearish Pattern
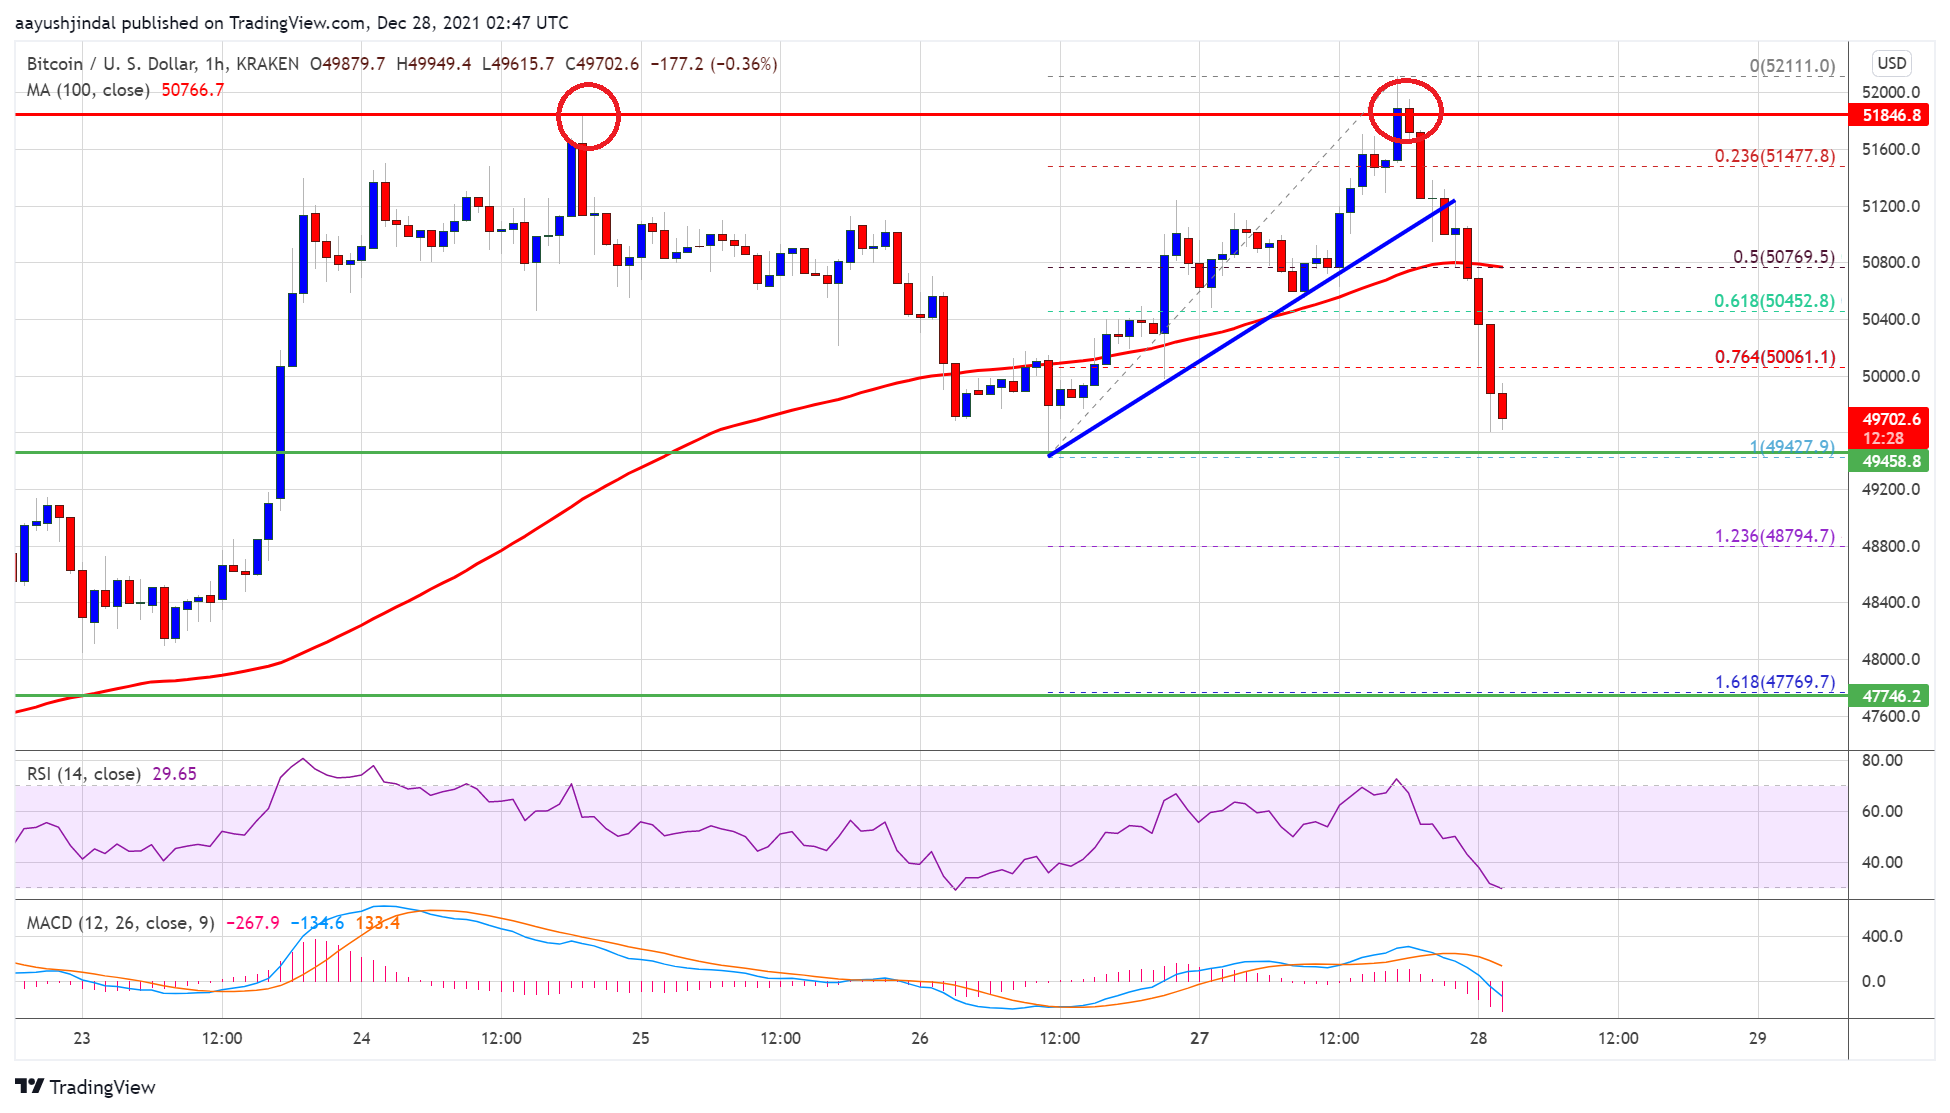
Bitcoin price made another attempt to clear the $51,800 resistance zone. BTC spiked towards the $52,000 zone, where the bears took a stand. It seems like there is a double top pattern forming near $52,000.
A high was formed near $52,111 and the price started a fresh decline. There was a break below the $51,200 and $50,500 support levels. There was also a break below a key bullish trend line with support near $51,200 on the hourly chart of the BTC/USD pair.
The pair traded below the 50% Fib retracement level of the upward move from the $49,477 swing low to $52,111 high. Bitcoin is now trading below $50,000 and the 100 hourly simple moving average.
It is also trading below the 76.4% Fib retracement level of the upward move from the $49,477 swing low to $52,111 high. An immediate support is near the $49,500 zone. The first major support is near $49,000.
Source: BTCUSD on TradingView.com
A downside break below the $49,000 level could push the price towards the $48,800 support. Any more losses may possibly push the price towards the $47,500 support zone.
Recovery In BTC?
If bitcoin manages to stay above the $49,500 support zone, it could start a decent increase. An immediate resistance on the upside is near the $50,000 level.
The next key resistance could be $50,800 and the 100 hourly SMA. A clear move above the $50,800 resistance zone could start a fresh increase. The next major stop for the bulls may possibly be near the $51,800 level.
Technical indicators:
Hourly MACD – The MACD is slowly gaining pace in the bearish zone.
Hourly RSI (Relative Strength Index) – The RSI for BTC/USD is well below the 50 level.
Major Support Levels – $49,500, followed by $47,500.
Major Resistance Levels – $50,000, $50,800 and $51,800.
Bitcoin failed to clear the $52,000 resistance zone against the US Dollar. BTC is started a major decline and traded below the $50,000 support.
Bitcoin made two attempts to clear the $51,800-$52,000 resistance zone but failed.
The price is trading below $50,000 and the 100 hourly simple moving average.
There was a break below a key bullish trend line with support near $51,200 on the hourly chart of the BTC/USD pair (data feed from Kraken).
The pair is declining and could even dive below the $49,500 support zone in the near term.
Bitcoin price made another attempt to clear the $51,800 resistance zone. BTC spiked towards the $52,000 zone, where the bears took a stand. It seems like there is a double top pattern forming near $52,000.
A high was formed near $52,111 and the price started a fresh decline. There was a break below the $51,200 and $50,500 support levels. There was also a break below a key bullish trend line with support near $51,200 on the hourly chart of the BTC/USD pair.
The pair traded below the 50% Fib retracement level of the upward move from the $49,477 swing low to $52,111 high. Bitcoin is now trading below $50,000 and the 100 hourly simple moving average.
It is also trading below the 76.4% Fib retracement level of the upward move from the $49,477 swing low to $52,111 high. An immediate support is near the $49,500 zone. The first major support is near $49,000.
Source: BTCUSD on TradingView.com
A downside break below the $49,000 level could push the price towards the $48,800 support. Any more losses may possibly push the price towards the $47,500 support zone.
If bitcoin manages to stay above the $49,500 support zone, it could start a decent increase. An immediate resistance on the upside is near the $50,000 level.
The next key resistance could be $50,800 and the 100 hourly SMA. A clear move above the $50,800 resistance zone could start a fresh increase. The next major stop for the bulls may possibly be near the $51,800 level.
Technical indicators:
Hourly MACD – The MACD is slowly gaining pace in the bearish zone.
Hourly RSI (Relative Strength Index) – The RSI for BTC/USD is well below the 50 level.
Major Support Levels – $49,500, followed by $47,500.
Major Resistance Levels – $50,000, $50,800 and $51,800.
Tags: bitcoinbtcusdBTCUSDTxbtusd
FeedzyRead More
Bitcoin Magazine David Bailey Confirmed As A Bitcoin 2026 Speaker David Bailey has been officially…
Bitcoin Magazine Paraguay Adopts Stricter Crypto Oversight, Mandates Detailed Transaction on Bitcoin Reporting Paraguay’s National…
Bitcoin Magazine Policy Group Calls for Bitcoin Inclusion in Proposed Crypto Tax Exemption The Bitcoin…
Bitcoin Magazine Corporate Bitcoin Holdings Hit Record High as Institutions Accumulate 2.8x Mining Supply: Report…
Research shows that only 8% to 10% of global Bitcoin hashrate runs in oil-sensitive power…
Today’s quantum computers are far from breaking Bitcoin’s cryptography and any real threat would likely…