Bitcoin climbed further above the $42,000 level against the US Dollar. BTC is showing positive signs and might rally further above $42,200.
Bitcoin remained well supported above the $41,000 and $41,100 levels.
The price is now trading above $41,500 and the 100 hourly simple moving average.
There is a key bullish trend line forming with support near $41,050 on the hourly chart of the BTC/USD pair (data feed from Kraken).
The pair might start a strong upward move if it settles above the $42,000 resistance zone.
Bitcoin Price Gains Pace
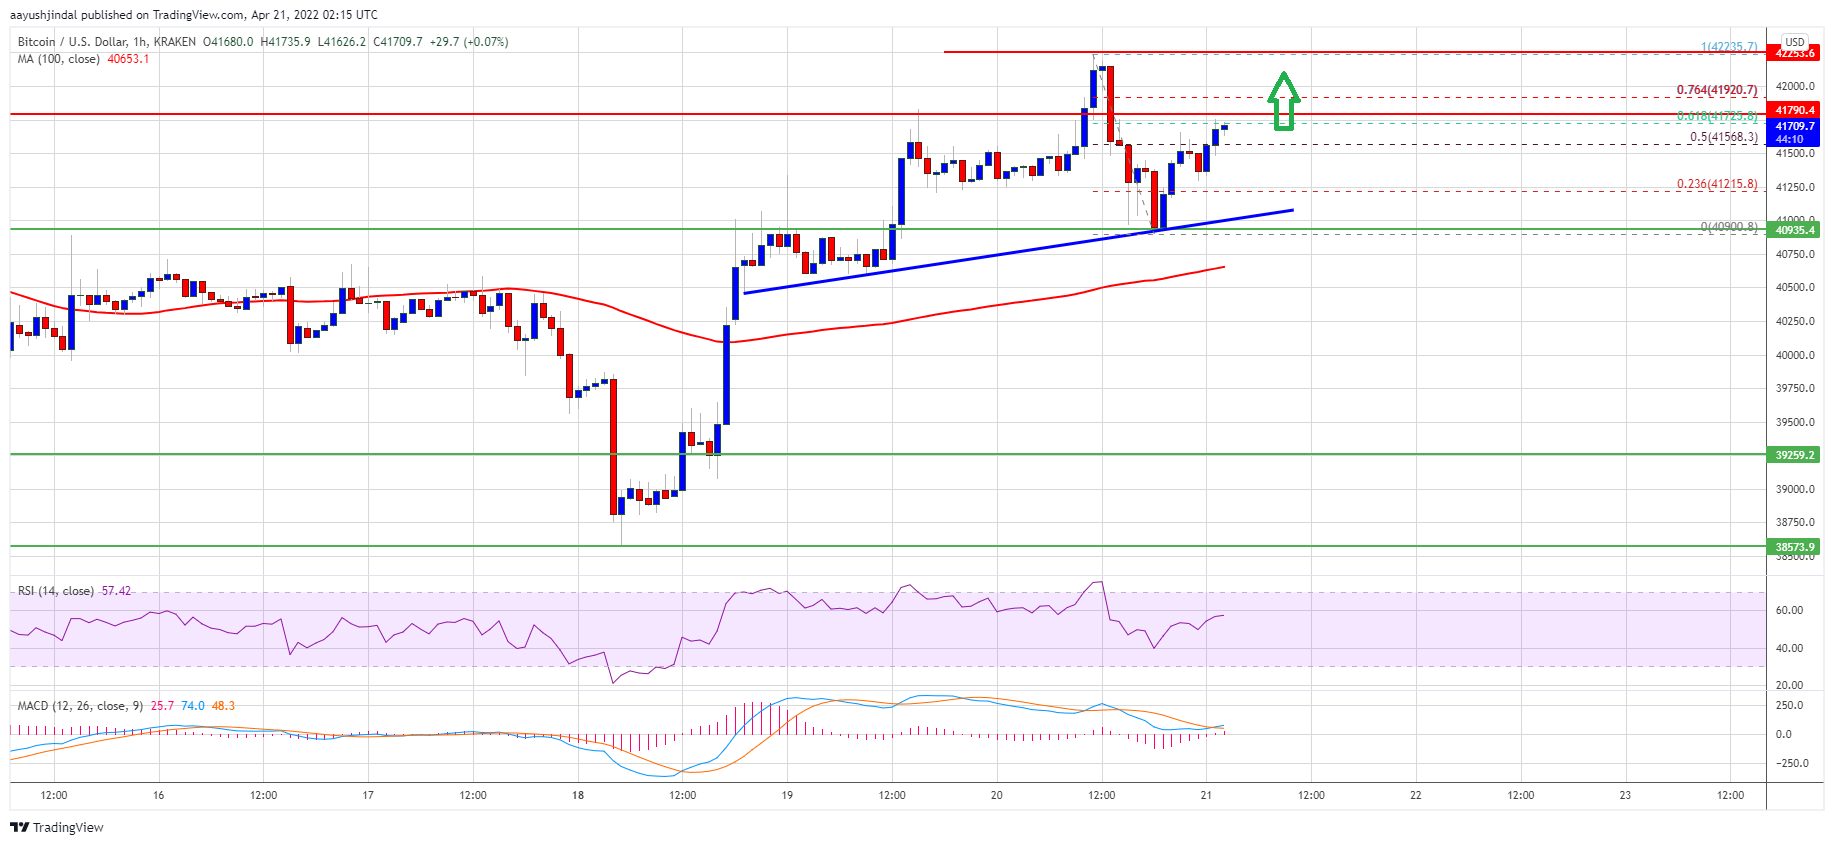
Bitcoin price extended increase above the $41,500 resistance zone. BTC even cleared the $42,000 resistance zone and settled above the 100 hourly simple moving average.
A high was formed near $42,235 before the price started a downside correction. There was a move below the $41,500 pivot level. The price even spiked below the $41,000 level, but it found support near the $40,900 level.
A fresh base was formed and the price is now back above $41,500. Bitcoin climbed above the 50% Fib retracement level of the recent decline from the $42,235 swing high to $40,900 low. It is now trading above $41,500 and the 100 hourly simple moving average.
There is also a key bullish trend line forming with support near $41,725USD pair. An immediate resistance on the upside is near the $41,725 level.
Source: BTCUSD on TradingView.com
The 61.8% Fib retracement level of the recent decline from the $42,235 swing high to $40,900 low is also near the $41,725 level. The next key resistance could be $42,000. To start a strong upward move, the price must settle above the $42,000 zone and then clear $42,230. If the bulls succeed, the price could rise towards the $43,200 resistance zone.
Dips Supported in BTC?
If bitcoin fails to clear the $42,000 resistance zone, it could start a downside correction. An immediate support on the downside is near the $41,250 level.
The next major support is seen near the $41,000 level and the trend line zone. A downside break below the trend line might send the price to $40,750 or the 100 hourly simple moving average.
Technical indicators:
Hourly MACD – The MACD is slowly gaining pace in the bullish zone.
Hourly RSI (Relative Strength Index) – The RSI for BTC/USD is now above the 50 level.
Major Support Levels – $41,250, followed by $41,000.
Major Resistance Levels – $41,725, $42,000 and $42,500.
Bitcoin climbed further above the $42,000 level against the US Dollar. BTC is showing positive signs and might rally further above $42,200.
Bitcoin remained well supported above the $41,000 and $41,100 levels.
The price is now trading above $41,500 and the 100 hourly simple moving average.
There is a key bullish trend line forming with support near $41,050 on the hourly chart of the BTC/USD pair (data feed from Kraken).
The pair might start a strong upward move if it settles above the $42,000 resistance zone.
Bitcoin price extended increase above the $41,500 resistance zone. BTC even cleared the $42,000 resistance zone and settled above the 100 hourly simple moving average.
A high was formed near $42,235 before the price started a downside correction. There was a move below the $41,500 pivot level. The price even spiked below the $41,000 level, but it found support near the $40,900 level.
A fresh base was formed and the price is now back above $41,500. Bitcoin climbed above the 50% Fib retracement level of the recent decline from the $42,235 swing high to $40,900 low. It is now trading above $41,500 and the 100 hourly simple moving average.
There is also a key bullish trend line forming with support near $41,725USD pair. An immediate resistance on the upside is near the $41,725 level.
Source: BTCUSD on TradingView.com
The 61.8% Fib retracement level of the recent decline from the $42,235 swing high to $40,900 low is also near the $41,725 level. The next key resistance could be $42,000. To start a strong upward move, the price must settle above the $42,000 zone and then clear $42,230. If the bulls succeed, the price could rise towards the $43,200 resistance zone.
If bitcoin fails to clear the $42,000 resistance zone, it could start a downside correction. An immediate support on the downside is near the $41,250 level.
The next major support is seen near the $41,000 level and the trend line zone. A downside break below the trend line might send the price to $40,750 or the 100 hourly simple moving average.
Technical indicators:
Hourly MACD – The MACD is slowly gaining pace in the bullish zone.
Hourly RSI (Relative Strength Index) – The RSI for BTC/USD is now above the 50 level.
Major Support Levels – $41,250, followed by $41,000.
Major Resistance Levels – $41,725, $42,000 and $42,500.
Tags: bitcoinbtcusdBTCUSDTxbtusd
FeedzyRead More
Bitcoin Magazine David Bailey Confirmed As A Bitcoin 2026 Speaker David Bailey has been officially…
Bitcoin Magazine Paraguay Adopts Stricter Crypto Oversight, Mandates Detailed Transaction on Bitcoin Reporting Paraguay’s National…
Bitcoin Magazine Policy Group Calls for Bitcoin Inclusion in Proposed Crypto Tax Exemption The Bitcoin…
Bitcoin Magazine Corporate Bitcoin Holdings Hit Record High as Institutions Accumulate 2.8x Mining Supply: Report…
Research shows that only 8% to 10% of global Bitcoin hashrate runs in oil-sensitive power…
Today’s quantum computers are far from breaking Bitcoin’s cryptography and any real threat would likely…