Bitcoin is consolidating losses above the $43,000 support against the US Dollar. BTC could correct higher towards the $44,275 resistance or $44,850.
Bitcoin managed to stay above the $43,000 support zone.
The price is still well below $45,000 and the 100 hourly simple moving average.
There is a key bearish trend line forming with resistance near $43,650 on the hourly chart of the BTC/USD pair (data feed from Kraken).
The pair could start an upside correction if it settles above $43,800.
Bitcoin Price Consolidates
Bitcoin price extended decline below the $45,000 support zone. BTC even spiked below the $43,000 level, but the bulls protected more downsides.
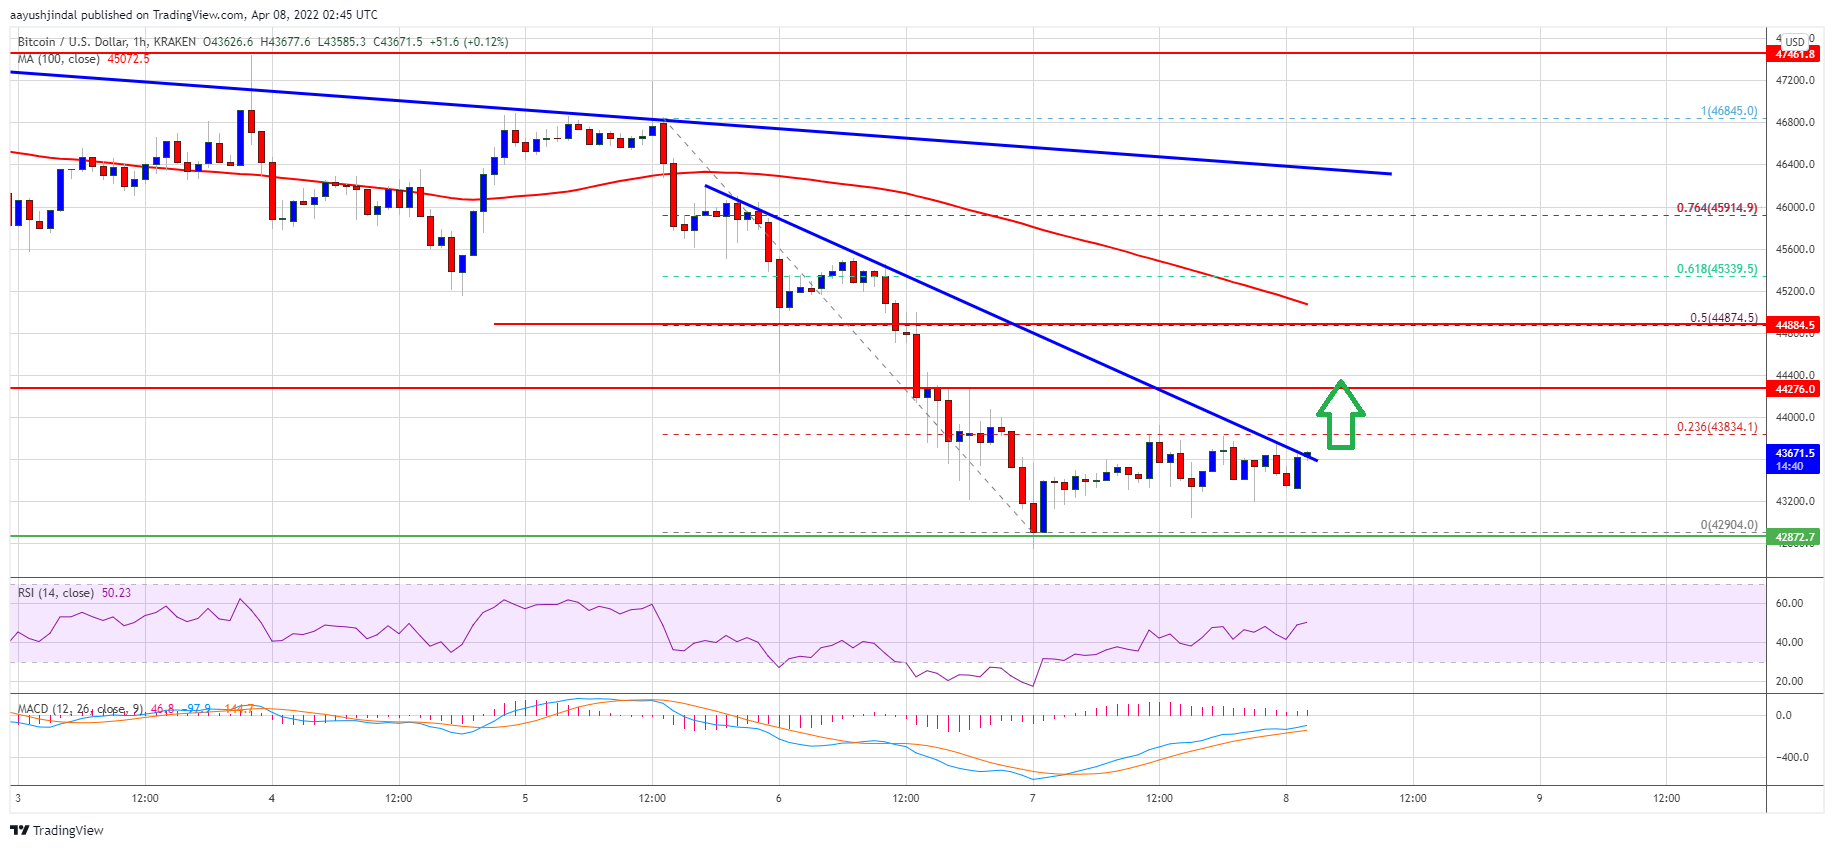
The price started trading in a range above the $43,000 level. However, it is still well below $45,000 and the 100 hourly simple moving average. It is now trading near a key bearish trend line forming with resistance near $43,650 on the hourly chart of the BTC/USD pair.
The first major barrier is near the $43,830 level. It is close to the 23.6% Fib retracement level of the key drop from the $46,845 swing high from the $42,905 low.
The next resistance could be near $44,275, where the price might struggle. If there is a move above $44,275, the price could test the $44,875 level. It is near the 50% Fib retracement level of the key drop from the $46,845 swing high from the $42,905 low.
Source: BTCUSD on TradingView.com
Bitcoin price must clear the $44,875 and $45,000 resistance levels to gain bullish momentum. In the stated case, the price may perhaps rise towards the $46,000 resistance zone. An intermediate resistance might be near the $45,500 level.
More Losses in BTC?
If bitcoin fails to clear the $44,875 resistance zone, it could continue to move down. An immediate support on the downside is near the $43,000 level.
The next major support is seen near the $42,900 level or the recent low. A downside break below the $42,900 support zone could accelerate losses. In the stated case, the price could drop towards the $42,200 support in the near term. The next major support might be $42,000.
Technical indicators:
Hourly MACD – The MACD is now gaining pace in the bullish zone.
Hourly RSI (Relative Strength Index) – The RSI for BTC/USD is now above the 50 level.
Major Support Levels – $43,000, followed by $42,000.
Major Resistance Levels – $43,875, $44,000 and $45,000.
Bitcoin is consolidating losses above the $43,000 support against the US Dollar. BTC could correct higher towards the $44,275 resistance or $44,850.
Bitcoin managed to stay above the $43,000 support zone.
The price is still well below $45,000 and the 100 hourly simple moving average.
There is a key bearish trend line forming with resistance near $43,650 on the hourly chart of the BTC/USD pair (data feed from Kraken).
The pair could start an upside correction if it settles above $43,800.
Bitcoin price extended decline below the $45,000 support zone. BTC even spiked below the $43,000 level, but the bulls protected more downsides.
The price started trading in a range above the $43,000 level. However, it is still well below $45,000 and the 100 hourly simple moving average. It is now trading near a key bearish trend line forming with resistance near $43,650 on the hourly chart of the BTC/USD pair.
The first major barrier is near the $43,830 level. It is close to the 23.6% Fib retracement level of the key drop from the $46,845 swing high from the $42,905 low.
The next resistance could be near $44,275, where the price might struggle. If there is a move above $44,275, the price could test the $44,875 level. It is near the 50% Fib retracement level of the key drop from the $46,845 swing high from the $42,905 low.
Source: BTCUSD on TradingView.com
Bitcoin price must clear the $44,875 and $45,000 resistance levels to gain bullish momentum. In the stated case, the price may perhaps rise towards the $46,000 resistance zone. An intermediate resistance might be near the $45,500 level.
If bitcoin fails to clear the $44,875 resistance zone, it could continue to move down. An immediate support on the downside is near the $43,000 level.
The next major support is seen near the $42,900 level or the recent low. A downside break below the $42,900 support zone could accelerate losses. In the stated case, the price could drop towards the $42,200 support in the near term. The next major support might be $42,000.
Technical indicators:
Hourly MACD – The MACD is now gaining pace in the bullish zone.
Hourly RSI (Relative Strength Index) – The RSI for BTC/USD is now above the 50 level.
Major Support Levels – $43,000, followed by $42,000.
Major Resistance Levels – $43,875, $44,000 and $45,000.
Tags: bitcoinbtcusdBTCUSDTxbtusd
FeedzyRead More
A tiny Strategy sale raised a bigger question about Saylor’s never-sell stance, while easing Iran…
TL;DR Aave Labs has proposed onboarding Circle Wrapped Bitcoin, or cirBTC, to Aave V3 Core…
Bitcoin Magazine Standard Chartered Calls Crypto Bottom as Bitcoin Price Recovers From $59,000 Low Standard…
Senior market analyst Geoffrey Kendrick pointed to the SpaceX IPO and a potential U.S.-Iran peace…
Bitcoin ETF investors have pulled billions this year, but the broader crypto ETF market remains…
Bitcoin Magazine SpaceX Officially Joins Public Bitcoin Leaderboard as 8th Largest Holder With 18,712 BTC…