Bitcoin formed a base near the $21,000 level against the US Dollar. BTC is attempting a recovery wave, but the bears might protect gains above $23,000.
Bitcoin traded as low as $20,824 before the bulls took a stand.
The price is now trading below the $24,000 level and the 100 hourly simple moving average.
There is a key bearish trend line forming with resistance near $22,050 on the hourly chart of the BTC/USD pair (data feed from Kraken).
The pair must clear the $23,000 resistance zone to start a decent recovery wave.
Bitcoin Price Remains In Downtrend
Bitcoin price remained in a bearish zone below the $25,000 support zone. The price spiked below the $21,000 level and settled well below the $23,000 level.
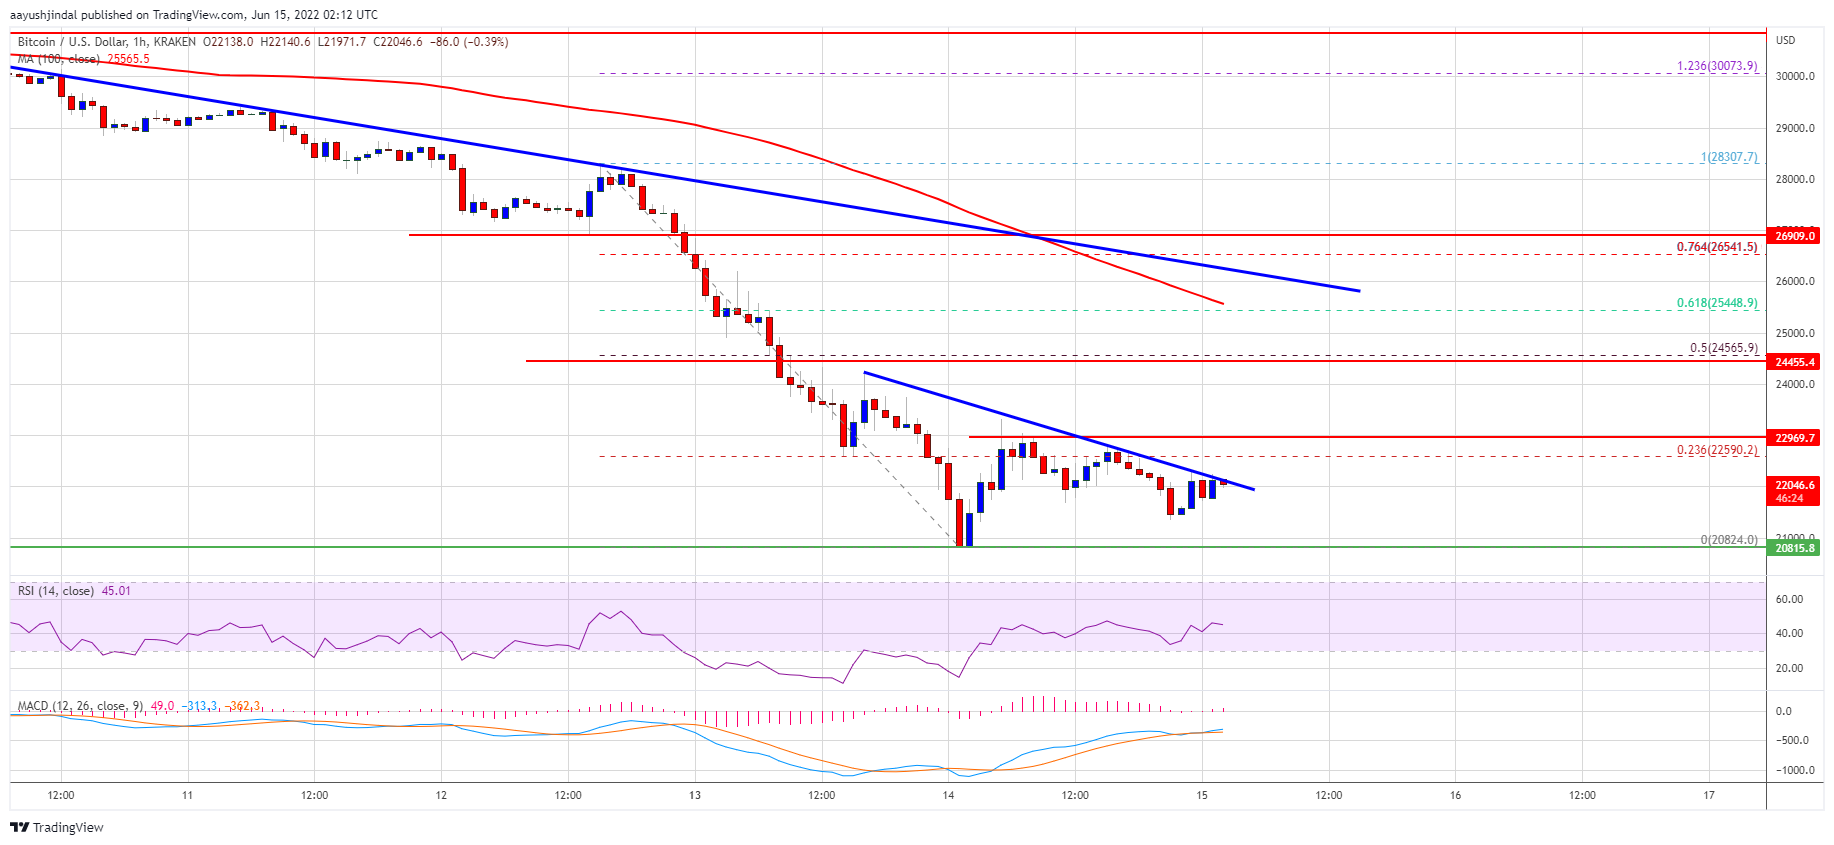
A low was formed near $20,824 and the price is now attempting an upside correction. There was a move above the $22,000 resistance level. However, the price is still well below the $24,000 level and the 100 hourly simple moving average.
An immediate resistance on the upside is near the $21,100 level. There is also a key bearish trend line forming with resistance near $22,050 on the hourly chart of the BTC/USD pair.
The first major resistance is near the $22,600 level. It is near the 23.6% Fib retracement level of the downward move from $28,300 swing high to $20,825 low. If there is a clear move above the trend line, the pair could rise towards the $23,000 resistance.
Source: BTCUSD on TradingView.com
The main resistance is near the $24,600 level. It is near the 50% Fib retracement level of the downward move from $28,300 swing high to $20,825 low. A clear move above the $24,500 and $25,000 levels could set the pace for a strong upward move.
Fresh Decline in BTC?
If bitcoin fails to clear the $22,600 resistance zone and the trend line, it could start a fresh decline. An immediate support on the downside is near the $21,250 level.
The next major support is near the $21,000 level. A downside break below the $21,000 support could send the price towards the $20,825 swing low. Any more losses may perhaps call for a test of $20,000.
Technical indicators:
Hourly MACD – The MACD is now losing pace in the bearish zone.
Hourly RSI (Relative Strength Index) – The RSI for BTC/USD is still below the 50 level.
Major Support Levels – $21,250, followed by $21,000.
Major Resistance Levels – $22,100, $22,600 and $23,000.
Bitcoin formed a base near the $21,000 level against the US Dollar. BTC is attempting a recovery wave, but the bears might protect gains above $23,000.
Bitcoin traded as low as $20,824 before the bulls took a stand.
The price is now trading below the $24,000 level and the 100 hourly simple moving average.
There is a key bearish trend line forming with resistance near $22,050 on the hourly chart of the BTC/USD pair (data feed from Kraken).
The pair must clear the $23,000 resistance zone to start a decent recovery wave.
Bitcoin price remained in a bearish zone below the $25,000 support zone. The price spiked below the $21,000 level and settled well below the $23,000 level.
A low was formed near $20,824 and the price is now attempting an upside correction. There was a move above the $22,000 resistance level. However, the price is still well below the $24,000 level and the 100 hourly simple moving average.
An immediate resistance on the upside is near the $21,100 level. There is also a key bearish trend line forming with resistance near $22,050 on the hourly chart of the BTC/USD pair.
The first major resistance is near the $22,600 level. It is near the 23.6% Fib retracement level of the downward move from $28,300 swing high to $20,825 low. If there is a clear move above the trend line, the pair could rise towards the $23,000 resistance.
Source: BTCUSD on TradingView.com
The main resistance is near the $24,600 level. It is near the 50% Fib retracement level of the downward move from $28,300 swing high to $20,825 low. A clear move above the $24,500 and $25,000 levels could set the pace for a strong upward move.
If bitcoin fails to clear the $22,600 resistance zone and the trend line, it could start a fresh decline. An immediate support on the downside is near the $21,250 level.
The next major support is near the $21,000 level. A downside break below the $21,000 support could send the price towards the $20,825 swing low. Any more losses may perhaps call for a test of $20,000.
Technical indicators:
Hourly MACD – The MACD is now losing pace in the bearish zone.
Hourly RSI (Relative Strength Index) – The RSI for BTC/USD is still below the 50 level.
Major Support Levels – $21,250, followed by $21,000.
Major Resistance Levels – $22,100, $22,600 and $23,000.
Tags: bitcoinbtcusdBTCUSDTxbtusd
FeedzyRead More
A tiny Strategy sale raised a bigger question about Saylor’s never-sell stance, while easing Iran…
TL;DR Aave Labs has proposed onboarding Circle Wrapped Bitcoin, or cirBTC, to Aave V3 Core…
Bitcoin Magazine Standard Chartered Calls Crypto Bottom as Bitcoin Price Recovers From $59,000 Low Standard…
Senior market analyst Geoffrey Kendrick pointed to the SpaceX IPO and a potential U.S.-Iran peace…
Bitcoin ETF investors have pulled billions this year, but the broader crypto ETF market remains…
Bitcoin Magazine SpaceX Officially Joins Public Bitcoin Leaderboard as 8th Largest Holder With 18,712 BTC…