Bitcoin is correcting losses and trading above $39,000 against the US Dollar. BTC could gain bullish momentum if it clears the $40,000 resistance zone.
Bitcoin is slowly recovering and trading above the $39,000 zone.
The price is trading above $39,200 and the 100 hourly simple moving average.
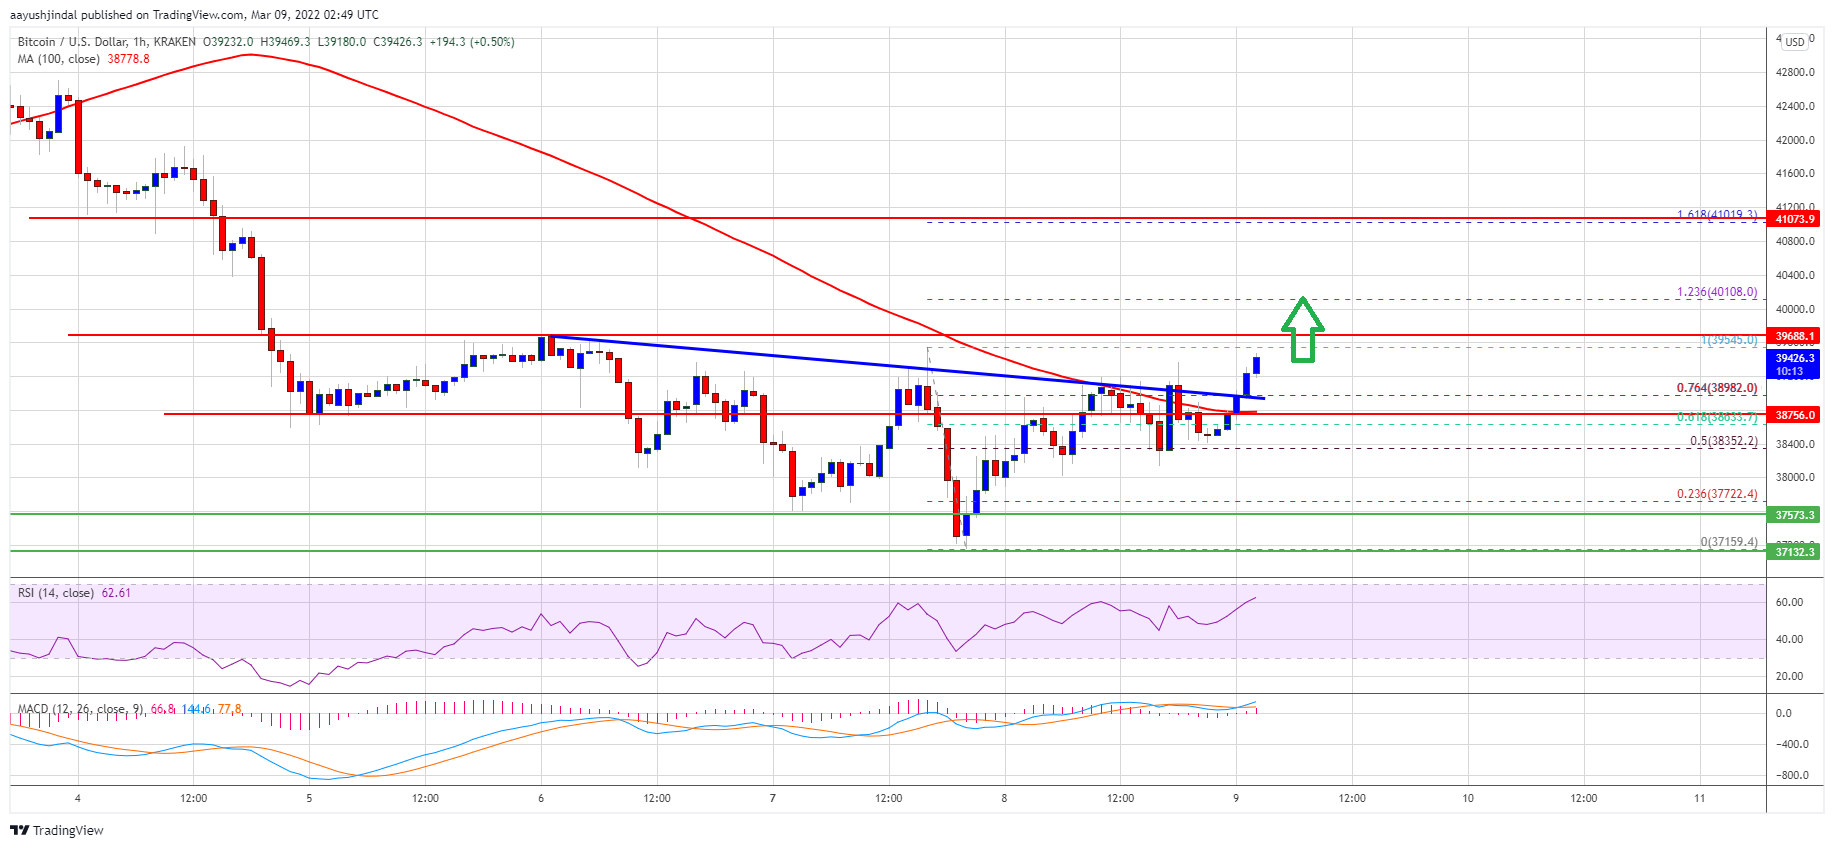
There was a break above a major bearish trend line with resistance near $38,980 on the hourly chart of the BTC/USD pair (data feed from Kraken).
The pair might accelerate higher and could even surpass the $40,000 resistance zone.
Bitcoin Price Starts Correction
Bitcoin price extended decline below the $38,000 support zone. However, BTC found support near the $37,150 zone and started a decent recovery wave.
A low was formed near $37,159 before the price corrected higher. There was a move above the $38,000 and $38,500 resistance levels. The price was able to climb above the 76.4% Fib retracement level of the downward move from the $39,545 swing high to $37,159 low.
Besides, there was a break above a major bearish trend line with resistance near $38,980 on the hourly chart of the BTC/USD pair. Bitcoin is now trading above $39,200 and the 100 hourly simple moving average.
On the upside, an immediate resistance is near the $39,545 swing high. The next major resistance is near the $40,000 level. If there is a clear move above the $40,000 resistance zone, the price might accelerate higher. In the stated case, the price could rise towards the $41,000 zone.
Source: BTCUSD on TradingView.com
The 1.618 Fib extension level of the downward move from the $39,545 swing high to $37,159 low is also near the $41,000 level. Any more gains might send the price towards the $42,200 level.
Another Rejection in BTC?
If bitcoin fails to clear the $40,000 resistance zone, it could start another decline. An immediate support on the downside is near the $39,150 zone.
The next major support is seen near the $38,800 level and the 100 hourly simple moving average. If there is a downside break below the $38,800 support, the price might gain bearish momentum. In the stated case, there is a risk of a move towards the $37,500 level.
Technical indicators:
Hourly MACD – The MACD is now gaining pace in the bullish zone.
Hourly RSI (Relative Strength Index) – The RSI for BTC/USD is now above the 50 level.
Major Support Levels – $39,150, followed by $38,800.
Major Resistance Levels – $39,545, $40,000 and $41,000.
Bitcoin is correcting losses and trading above $39,000 against the US Dollar. BTC could gain bullish momentum if it clears the $40,000 resistance zone.
Bitcoin is slowly recovering and trading above the $39,000 zone.
The price is trading above $39,200 and the 100 hourly simple moving average.
There was a break above a major bearish trend line with resistance near $38,980 on the hourly chart of the BTC/USD pair (data feed from Kraken).
The pair might accelerate higher and could even surpass the $40,000 resistance zone.
Bitcoin price extended decline below the $38,000 support zone. However, BTC found support near the $37,150 zone and started a decent recovery wave.
A low was formed near $37,159 before the price corrected higher. There was a move above the $38,000 and $38,500 resistance levels. The price was able to climb above the 76.4% Fib retracement level of the downward move from the $39,545 swing high to $37,159 low.
Besides, there was a break above a major bearish trend line with resistance near $38,980 on the hourly chart of the BTC/USD pair. Bitcoin is now trading above $39,200 and the 100 hourly simple moving average.
On the upside, an immediate resistance is near the $39,545 swing high. The next major resistance is near the $40,000 level. If there is a clear move above the $40,000 resistance zone, the price might accelerate higher. In the stated case, the price could rise towards the $41,000 zone.
Source: BTCUSD on TradingView.com
The 1.618 Fib extension level of the downward move from the $39,545 swing high to $37,159 low is also near the $41,000 level. Any more gains might send the price towards the $42,200 level.
If bitcoin fails to clear the $40,000 resistance zone, it could start another decline. An immediate support on the downside is near the $39,150 zone.
The next major support is seen near the $38,800 level and the 100 hourly simple moving average. If there is a downside break below the $38,800 support, the price might gain bearish momentum. In the stated case, there is a risk of a move towards the $37,500 level.
Technical indicators:
Hourly MACD – The MACD is now gaining pace in the bullish zone.
Hourly RSI (Relative Strength Index) – The RSI for BTC/USD is now above the 50 level.
Major Support Levels – $39,150, followed by $38,800.
Major Resistance Levels – $39,545, $40,000 and $41,000.
Tags: bitcoinbtcusdBTCUSDTxbtusd
FeedzyRead More
Bitcoin is holding on to its weekend gains as oil trades lower. ETFs lost over…
Bitcoin and ether order books are deeper than before the crash, while altcoin liquidity keeps…
One year after a flash crash wiped out billions in leveraged crypto bets, traders have…
CoinDesk analysis finds 10 unusually large trading days in 2026, raising questions about how investors…
Bitcoin Magazine Bitcoin Life Insurer Meanwhile Raises $37.5M as Wealthy Families Look to Pass On…
Bitcoin Magazine Here’s How Not To Screw up Your Bitcoin Privacy Just one transaction can…