Bitcoin started a downside correction and traded below $42,000 against the US Dollar. BTC must stay above $40,000 to avoid a trend reversal.
Bitcoin started a fresh decline below the $43,000 and $42,000 levels.
The price is trading below $43,000 and the 100 hourly simple moving average.
There was a break below a major bullish trend line with support near $42,500 on the hourly chart of the BTC/USD pair (data feed from Kraken).
The pair might correct further, but the $40,000 support is the key.
Bitcoin Price Breaks Support
Bitcoin price failed to stay above the $43,000 support zone. BTC extended decline and traded below the $42,500 support level.
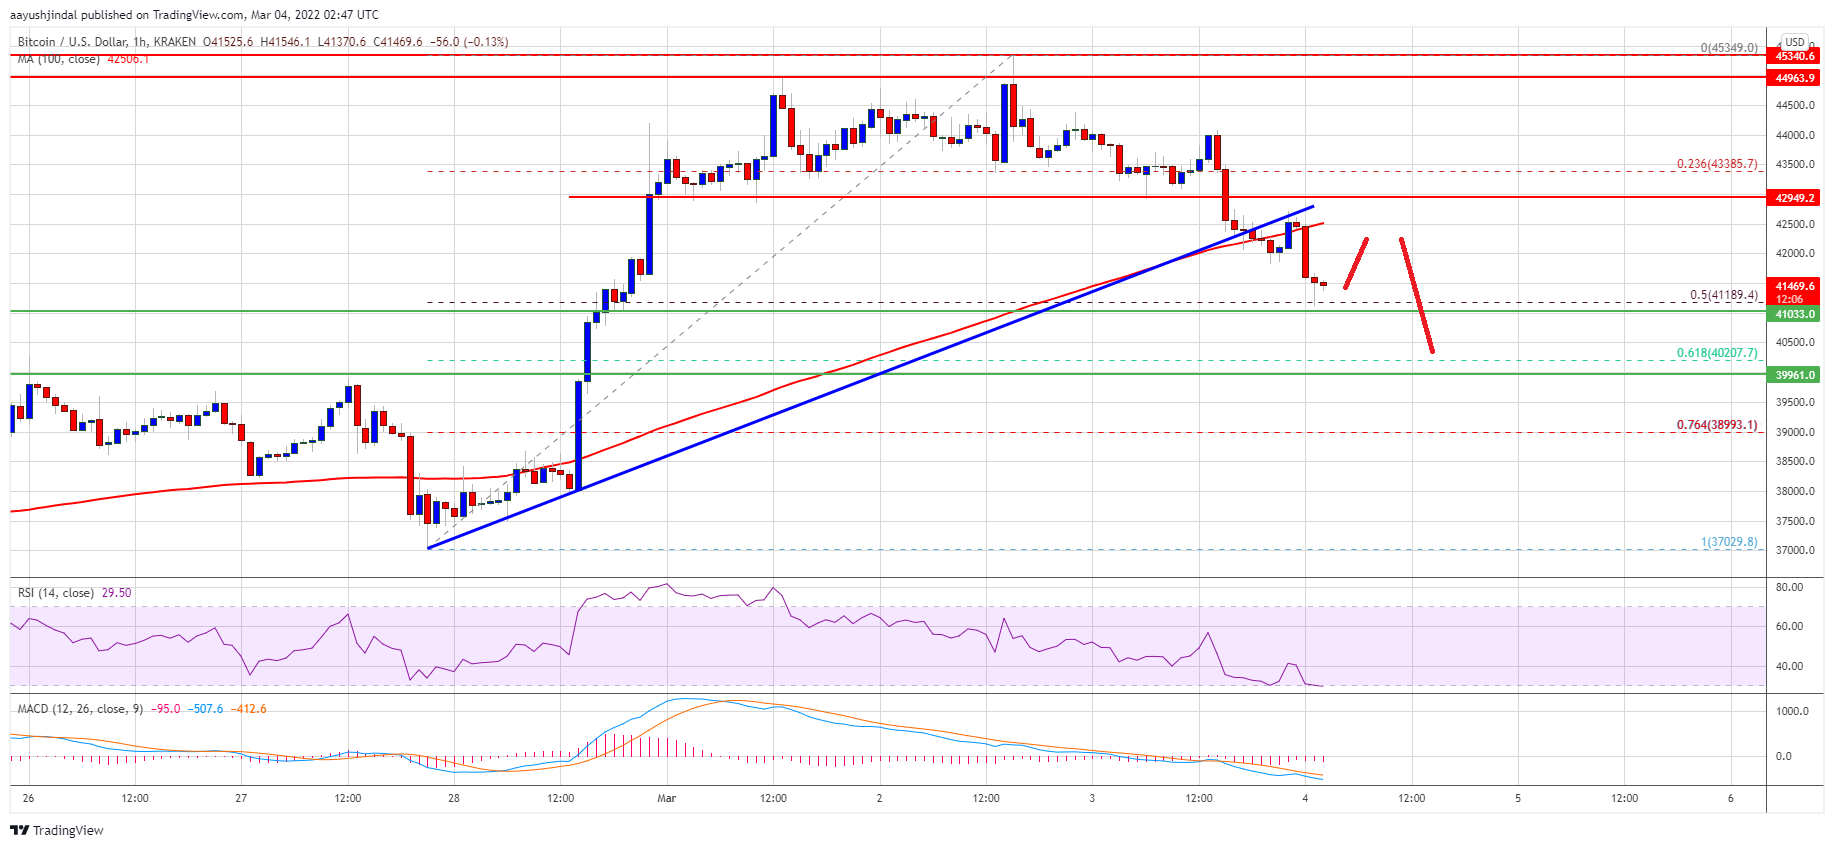
There was a move below the 23.6% Fib retracement level of the key increase from the $37,030 swing low to $45,350 high. Besides, there was a break below a major bullish trend line with support near $42,500 on the hourly chart of the BTC/USD pair.
Bitcoin is now trading below $43,000 and the 100 hourly simple moving average. It is testing the $41,200 support level. It is also near the 50% Fib retracement level of the key increase from the $37,030 swing low to $45,350 high.
If the price stays above the $41,200 support, it could attempt a fresh increase. On the upside, an initial resistance is near the $42,000 level. The first key resistance is near the $42,500 level and the 100 hourly simple moving average.
Source: BTCUSD on TradingView.com
A clear move above the $42,500 resistance might set the pace for a fresh increase. In the stated case, the price could surpass the $43,000 resistance zone. The next major resistance for the bulls may possibly be near the $44,200 level.
More Losses in BTC?
If bitcoin fails to clear the $42,500 resistance zone, it could continue to move down. An immediate support on the downside is near the $41,200 zone.
The next major support is seen near the $40,200 level. The main support is still near the $40,000 level. If there is a downside break below the $40,000 support, the price might start a major decline.
Technical indicators:
Hourly MACD – The MACD is now gaining pace in the bearish zone.
Hourly RSI (Relative Strength Index) – The RSI for BTC/USD is now near the 30 level.
Major Support Levels – $41,200, followed by $40,000.
Major Resistance Levels – $42,000, $42,500 and $43,000.
Bitcoin started a downside correction and traded below $42,000 against the US Dollar. BTC must stay above $40,000 to avoid a trend reversal.
Bitcoin started a fresh decline below the $43,000 and $42,000 levels.
The price is trading below $43,000 and the 100 hourly simple moving average.
There was a break below a major bullish trend line with support near $42,500 on the hourly chart of the BTC/USD pair (data feed from Kraken).
The pair might correct further, but the $40,000 support is the key.
Bitcoin price failed to stay above the $43,000 support zone. BTC extended decline and traded below the $42,500 support level.
There was a move below the 23.6% Fib retracement level of the key increase from the $37,030 swing low to $45,350 high. Besides, there was a break below a major bullish trend line with support near $42,500 on the hourly chart of the BTC/USD pair.
Bitcoin is now trading below $43,000 and the 100 hourly simple moving average. It is testing the $41,200 support level. It is also near the 50% Fib retracement level of the key increase from the $37,030 swing low to $45,350 high.
If the price stays above the $41,200 support, it could attempt a fresh increase. On the upside, an initial resistance is near the $42,000 level. The first key resistance is near the $42,500 level and the 100 hourly simple moving average.
Source: BTCUSD on TradingView.com
A clear move above the $42,500 resistance might set the pace for a fresh increase. In the stated case, the price could surpass the $43,000 resistance zone. The next major resistance for the bulls may possibly be near the $44,200 level.
If bitcoin fails to clear the $42,500 resistance zone, it could continue to move down. An immediate support on the downside is near the $41,200 zone.
The next major support is seen near the $40,200 level. The main support is still near the $40,000 level. If there is a downside break below the $40,000 support, the price might start a major decline.
Technical indicators:
Hourly MACD – The MACD is now gaining pace in the bearish zone.
Hourly RSI (Relative Strength Index) – The RSI for BTC/USD is now near the 30 level.
Major Support Levels – $41,200, followed by $40,000.
Major Resistance Levels – $42,000, $42,500 and $43,000.
Tags: bitcoinbtcusdBTCUSDTxbtusd
FeedzyRead More
Spot bitcoin funds lost about $95 million on Thursday and ether funds roughly $52 million,…
A smoother long-term MACD just flipped bullish, pointing to more upside. Here are key levels…
Bitcoin is up 4.2% over seven days that contained an oil shock, a bond selloff…
A sharp rise in the yen has left bitcoin and other major cryptocurrencies underperforming in…
At its last stage for government approval, the state's executive council rejected the bond project…
Bitcoin Magazine JPMorgan Says the Real Threat to Bitcoin Isn’t Strategy (MSTR) — It’s Private…