Bitcoin gained pace above the $47,000 resistance against the US Dollar. BTC is showing positive signs and might rally towards the $50,000 resistance zone.
Bitcoin saw a major technical breakout above the $45,500 resistance zone.
The price is trading above $46,500 and the 100 hourly simple moving average.
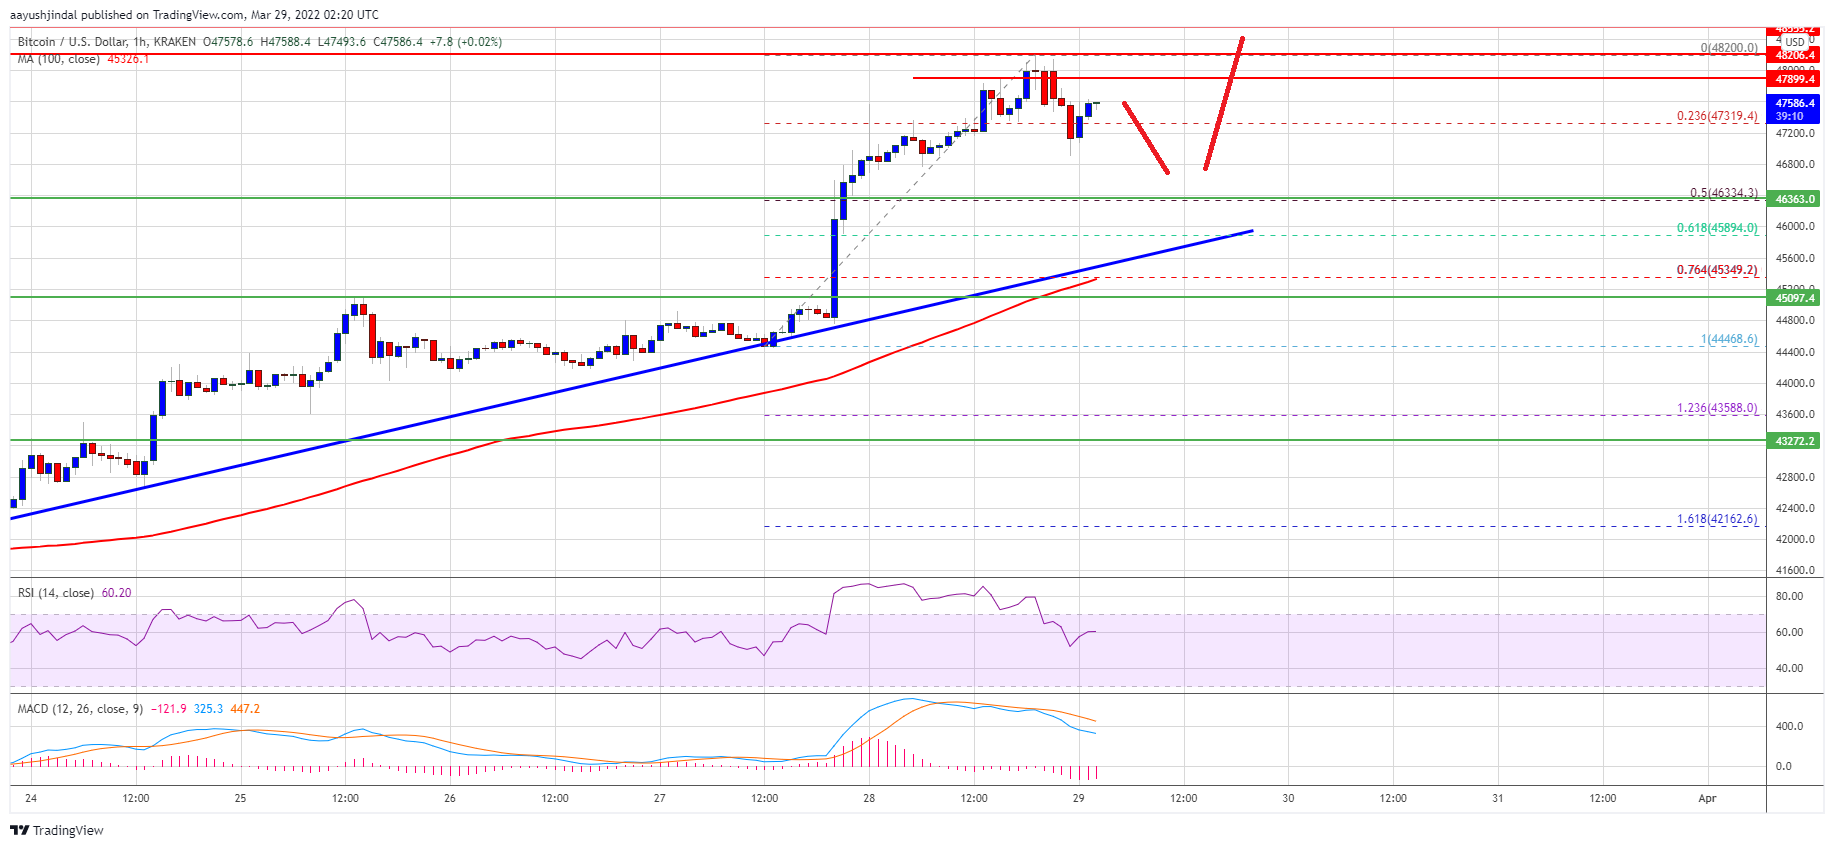
There is a crucial bullish trend line forming with support near $46,200 on the hourly chart of the BTC/USD pair (data feed from Kraken).
The pair could continue to rise and might trade towards the $50,000 resistance zone.
Bitcoin Price Breaks $48K
Bitcoin price remained strong above the $45,500 resistance zone. BTC started a fresh increase and was able to clear the $46,500 resistance zone.
The upward move gained pace above the $46,500 level and the price settled above the 100 hourly simple moving average. Finally, it spiked above the $48,000 level. A high was formed near $48,200 and the price is now consolidating gains.
There was a minor drop below the $48,000 level. Bitcoin traded below the 23.6% Fib retracement level of the upward move from the $44,470 swing low $48,200 high. Besides, there is a crucial bullish trend line forming with support near $46,200 on the hourly chart of the BTC/USD pair.
On the upside, the price is facing resistance near the $48,000 level. The next major resistance could be near the $48,200 zone. A successful break and close above the $48,200 level might push the price towards $49,000.
Source: BTCUSD on TradingView.com
The next major resistance could be near the $49,500 level. Any more gains could open the doors for a move towards the $50,000 level.
Dips Limited in BTC?
If bitcoin fails to clear the $48,200 resistance zone, it could start a downside correction. An immediate support on the downside is near the $47,000 zone.
The next major support is seen near the $46,350 level. It is near the 50% Fib retracement level of the upward move from the $44,470 swing low $48,200 high. The main support is near the $46,000 level and the trend line. A downside break below the $46,000 support zone could send the price to $45,000.
Technical indicators:
Hourly MACD – The MACD is slowly gaining pace in the bearish zone.
Hourly RSI (Relative Strength Index) – The RSI for BTC/USD is now above the 50 level.
Major Support Levels – $47,000, followed by $46,000.
Major Resistance Levels – $48,200, $49,000 and $50,000.
Bitcoin gained pace above the $47,000 resistance against the US Dollar. BTC is showing positive signs and might rally towards the $50,000 resistance zone.
Bitcoin saw a major technical breakout above the $45,500 resistance zone.
The price is trading above $46,500 and the 100 hourly simple moving average.
There is a crucial bullish trend line forming with support near $46,200 on the hourly chart of the BTC/USD pair (data feed from Kraken).
The pair could continue to rise and might trade towards the $50,000 resistance zone.
Bitcoin price remained strong above the $45,500 resistance zone. BTC started a fresh increase and was able to clear the $46,500 resistance zone.
The upward move gained pace above the $46,500 level and the price settled above the 100 hourly simple moving average. Finally, it spiked above the $48,000 level. A high was formed near $48,200 and the price is now consolidating gains.
There was a minor drop below the $48,000 level. Bitcoin traded below the 23.6% Fib retracement level of the upward move from the $44,470 swing low $48,200 high. Besides, there is a crucial bullish trend line forming with support near $46,200 on the hourly chart of the BTC/USD pair.
On the upside, the price is facing resistance near the $48,000 level. The next major resistance could be near the $48,200 zone. A successful break and close above the $48,200 level might push the price towards $49,000.
Source: BTCUSD on TradingView.com
The next major resistance could be near the $49,500 level. Any more gains could open the doors for a move towards the $50,000 level.
If bitcoin fails to clear the $48,200 resistance zone, it could start a downside correction. An immediate support on the downside is near the $47,000 zone.
The next major support is seen near the $46,350 level. It is near the 50% Fib retracement level of the upward move from the $44,470 swing low $48,200 high. The main support is near the $46,000 level and the trend line. A downside break below the $46,000 support zone could send the price to $45,000.
Technical indicators:
Hourly MACD – The MACD is slowly gaining pace in the bearish zone.
Hourly RSI (Relative Strength Index) – The RSI for BTC/USD is now above the 50 level.
Major Support Levels – $47,000, followed by $46,000.
Major Resistance Levels – $48,200, $49,000 and $50,000.
Tags: bitcoinbtcusdBTCUSDTxbtusd
FeedzyRead More
TL;DR VanEck has taken a closer look at dilution inside Metaplanet’s Bitcoin treasury strategy. Its…
Bitcoin Magazine Why Legendary Investor Bill Miller IV has “Never Been More Bullish on Bitcoin”…
Bitcoin Magazine Strategy CEO Phong Le: We Want to Be the JPMorgan of Bitcoin Strategy’s…
Bitcoin Magazine Coinbase Policy Chief: Strategic Bitcoin Reserve Bill Outlook The Clarity Act’s cloture vote…
Bitcoin Magazine T. Rowe Price’s Blue Macellari: Bitcoin is Now Core to the Debasement Conversation…
Bitcoin Magazine Move Over Housing – Bitcoin is Gen Z’s New Wealth Building Asset Gen…