Bitcoin started a fresh increase above the $42,500 resistance against the US Dollar. BTC may soon attempt an upside break above the $43,500 resistance zone.
Bitcoin remained supported near $42,000 and started a fresh increase.
The price is trading above $42,500 and the 100 hourly simple moving average.
There is a major bullish trend line forming with support near $42,300 on the hourly chart of the BTC/USD pair (data feed from Kraken).
The pair could accelerate higher if there is a clear move above the $43,300 resistance zone.
Bitcoin Price Eyes Upside Break
Bitcoin price found support near the $42,000 zone after a downside correction. BTC formed a base and started a fresh increase above the $42,500 resistance zone.
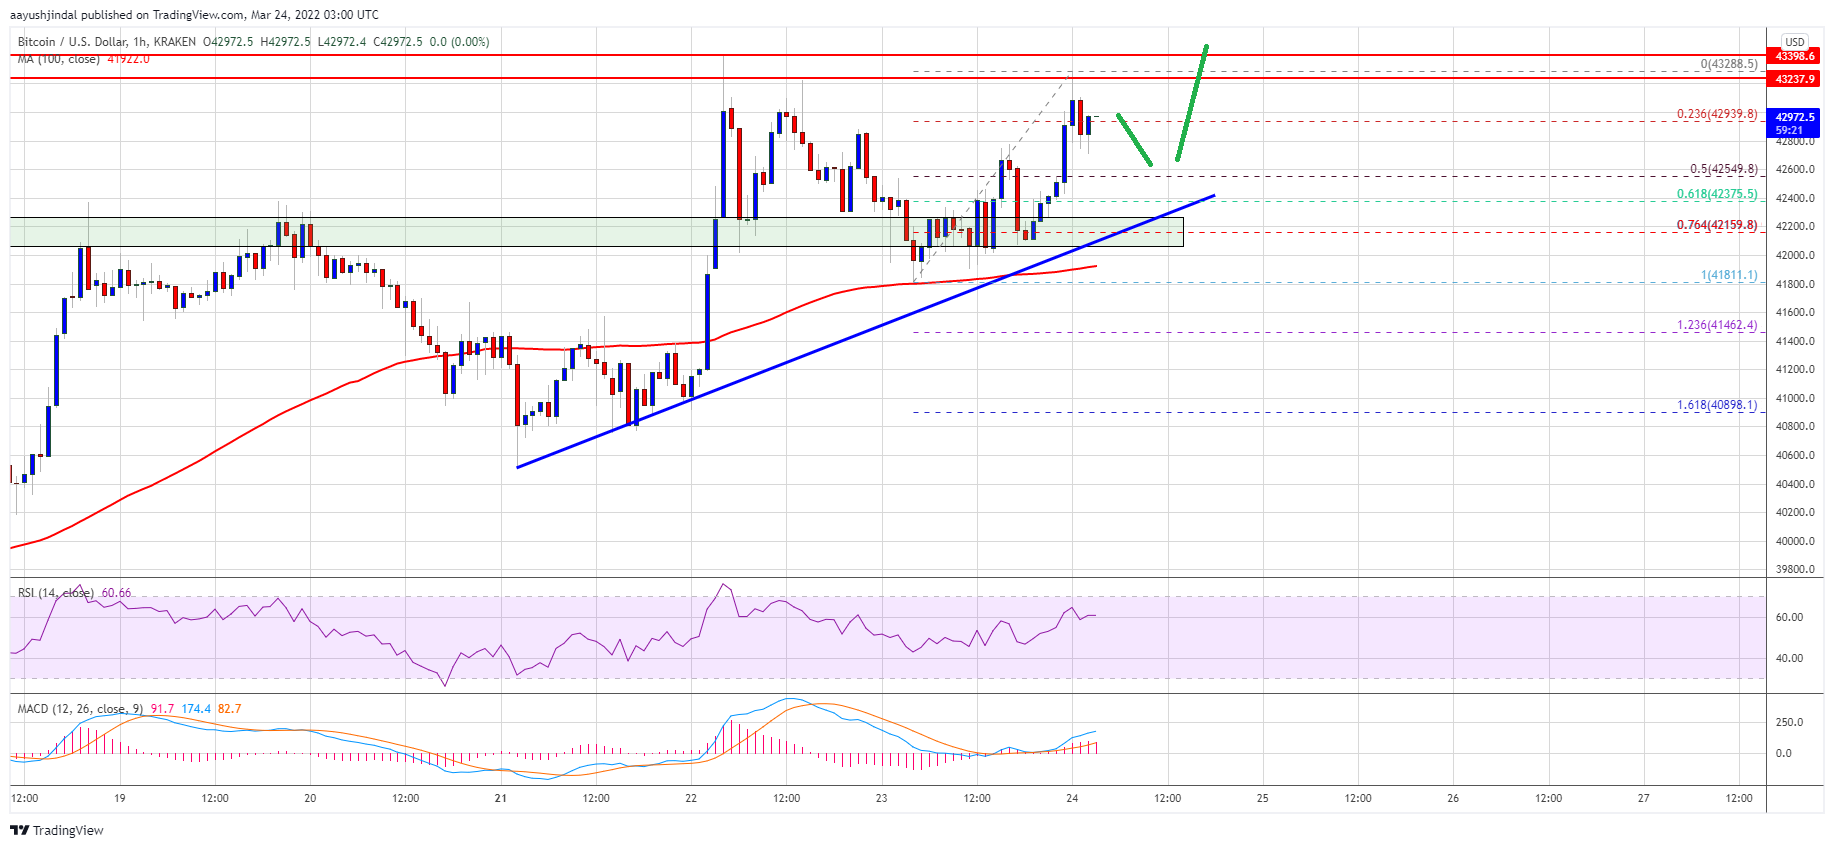
There was a clear move above the $42,800 level and the price settled above the 100 hourly simple moving average. The price even spike above the $43,000 level and formed a high near $43,288. It is now consolidating near the $43,000 level.
There was a move below the 23.6% Fib retracement level of the recent wave from the $41,811 swing low to $43,288 high. Besides, there is a major bullish trend line forming with support near $42,300 on the hourly chart of the BTC/USD pair.
On the upside, the price is facing resistance near the $43,300 level. The next major resistance could be near the $43,500 zone. A successful break and close above the $43,500 level might start another steady increase.
Source: BTCUSD on TradingView.com
In the stated case, the price might rise towards the $44,200 level. Any more gains could send the price towards the $45,000 level in the near term.
Dips Limited in BTC?
If bitcoin fails to clear the $43,500 resistance zone, it could correct further lower. An immediate support on the downside is near the $42,500 zone.
The next major support is seen near the trend line and $42,300. It is near the 61.8% Fib retracement level of the recent wave from the $41,811 swing low to $43,288 high. The main support is still near the $42,000 zone. A downside break below the $42,000 support zone could start a drop towards the $40,500 level.
Technical indicators:
Hourly MACD – The MACD is now gaining pace in the bullish zone.
Hourly RSI (Relative Strength Index) – The RSI for BTC/USD is now above the 50 level.
Major Support Levels – $42,500, followed by $42,000.
Major Resistance Levels – $43,300, $43,400 and $44,200.
Bitcoin started a fresh increase above the $42,500 resistance against the US Dollar. BTC may soon attempt an upside break above the $43,500 resistance zone.
Bitcoin remained supported near $42,000 and started a fresh increase.
The price is trading above $42,500 and the 100 hourly simple moving average.
There is a major bullish trend line forming with support near $42,300 on the hourly chart of the BTC/USD pair (data feed from Kraken).
The pair could accelerate higher if there is a clear move above the $43,300 resistance zone.
Bitcoin price found support near the $42,000 zone after a downside correction. BTC formed a base and started a fresh increase above the $42,500 resistance zone.
There was a clear move above the $42,800 level and the price settled above the 100 hourly simple moving average. The price even spike above the $43,000 level and formed a high near $43,288. It is now consolidating near the $43,000 level.
There was a move below the 23.6% Fib retracement level of the recent wave from the $41,811 swing low to $43,288 high. Besides, there is a major bullish trend line forming with support near $42,300 on the hourly chart of the BTC/USD pair.
On the upside, the price is facing resistance near the $43,300 level. The next major resistance could be near the $43,500 zone. A successful break and close above the $43,500 level might start another steady increase.
Source: BTCUSD on TradingView.com
In the stated case, the price might rise towards the $44,200 level. Any more gains could send the price towards the $45,000 level in the near term.
If bitcoin fails to clear the $43,500 resistance zone, it could correct further lower. An immediate support on the downside is near the $42,500 zone.
The next major support is seen near the trend line and $42,300. It is near the 61.8% Fib retracement level of the recent wave from the $41,811 swing low to $43,288 high. The main support is still near the $42,000 zone. A downside break below the $42,000 support zone could start a drop towards the $40,500 level.
Technical indicators:
Hourly MACD – The MACD is now gaining pace in the bullish zone.
Hourly RSI (Relative Strength Index) – The RSI for BTC/USD is now above the 50 level.
Major Support Levels – $42,500, followed by $42,000.
Major Resistance Levels – $43,300, $43,400 and $44,200.
Tags: bitcoinbtcusdBTCUSDTxbtusd
FeedzyRead More
Your day-ahead look for May 26, 2026Read MoreCoinDesk: Bitcoin, Ethereum, Crypto News and Price Data[#item_full_content]
The bitcoin price chart is forming a potential lower high while ether languishes in a…
Heavy supply concentration and large options positioning continue to suppress volatility and keep bitcoin range-bound.Read…
As Bitcoin (BTC) recovers from its recent drop below the $75,000 support, some market observers…
Bitcoin’s recent drop below key support may have been more than just a bearish breakdown.…
Enflux says “the bid is there” but no one is adding size, while Glassnode data…