Bitcoin started a fresh increase and surpassed $31,000 against the US Dollar. BTC could correct gains, but dips might remain well supported above $30,800.
Bitcoin is gaining pace above the $30,500 and $31,000 resistance levels.
The price is now trading above the $31,000 level and the 100 hourly simple moving average.
There is a connecting bullish trend line forming with support near $31,250 on the hourly chart of the BTC/USD pair (data feed from Kraken).
The pair could rally further if it clears the $32,200 resistance zone.
Bitcoin Price Rallies 5%
Bitcoin price remained well bid above the $30,000 pivot level. It formed a base and started a fresh increase above the $30,500 resistance zone.
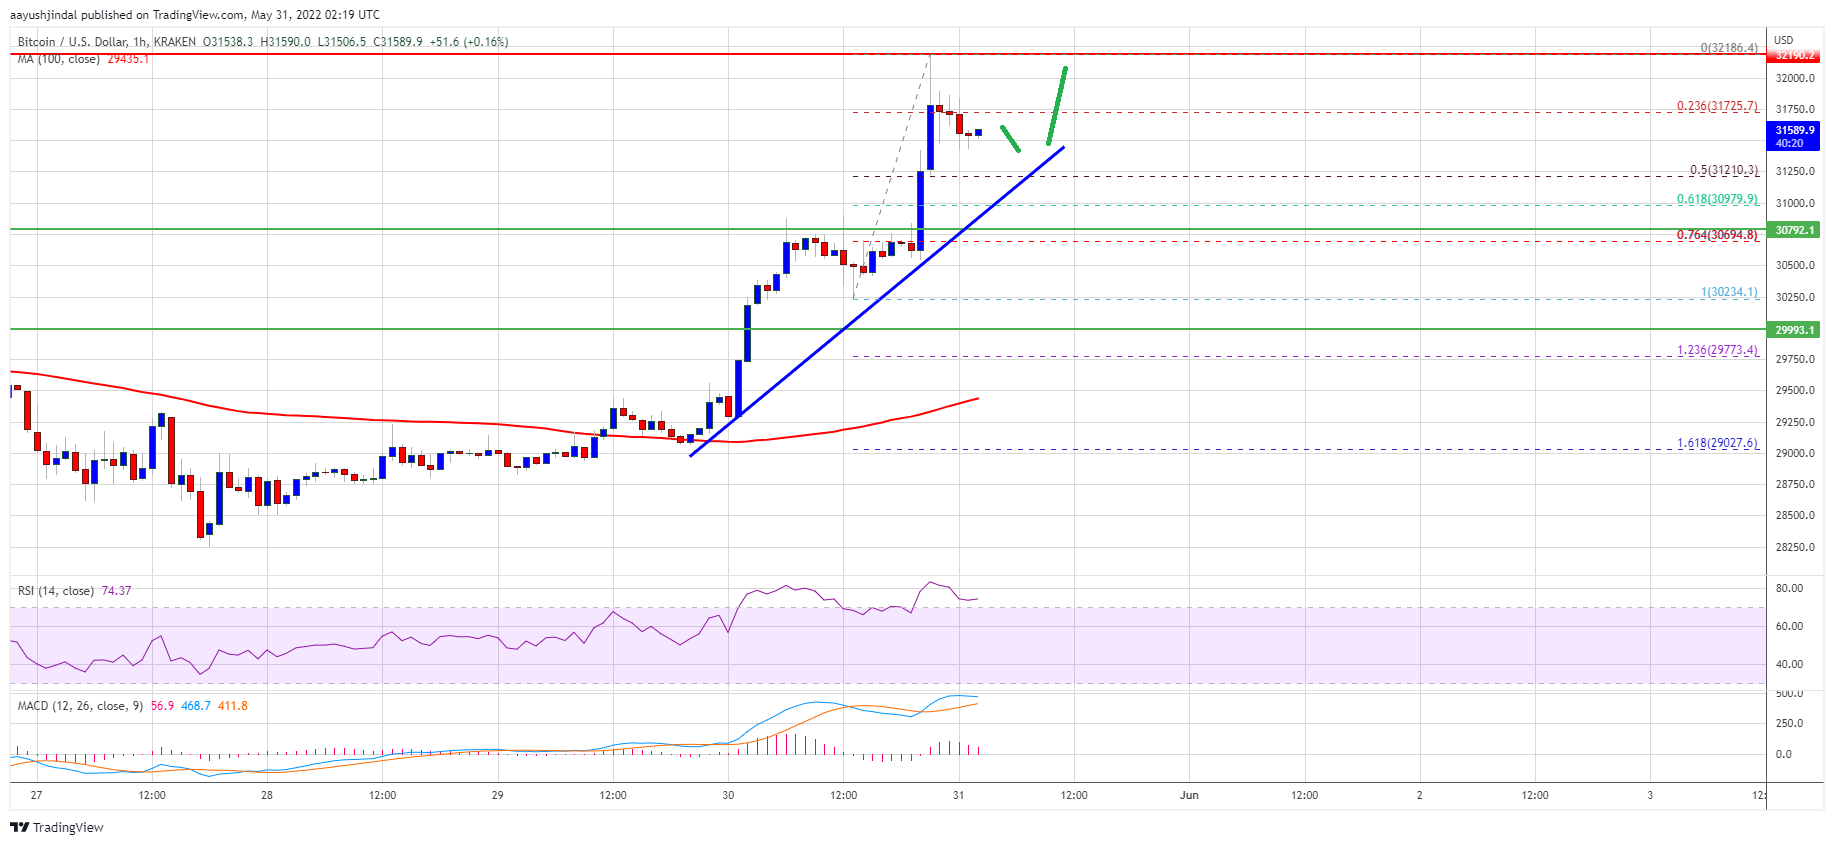
The price gained pace above the $31,200 resistance zone and settled well above the 100 hourly simple moving average. Finally, there was a spike above the $32,000 level and the price traded as high as $32,186. It is now correcting gains below $32,000.
There was a move below the 23.6% Fib retracement level of the upward move from the $30,234 swing low to $32,186 high. However, there is a connecting bullish trend line forming with support near $31,250 on the hourly chart of the BTC/USD pair.
Source: BTCUSD on TradingView.com
An immediate resistance on the upside is near the $32,200 level. The next major resistance is near the $32,200 level. A clear move above the $32,200 resistance level might call another increase. In the stated case, the price could even clear the $32,500 resistance. The next major resistance sits near the $33,400 level.
Dips Limited in BTC?
If bitcoin fails to clear the $32,200 resistance zone, it could start a downside correction. An immediate support on the downside is near the $31,500 level. The first major support is near the $31,250 level and the trend line. It is close to the 50% Fib retracement level of the upward move from the $30,234 swing low to $32,186 high.
The main support is now forming near the $30,800 level. A downside break below the $30,800 support might put a lot of pressure on the bulls. In the stated case, the price may perhaps revisit the $30,000 support zone in the near term.
Technical indicators:
Hourly MACD – The MACD is now losing pace in the bullish zone.
Hourly RSI (Relative Strength Index) – The RSI for BTC/USD is now well above the 60 level.
Major Support Levels – $31,250, followed by $30,800.
Major Resistance Levels – $32,200, $32,200 and $33,400.
Bitcoin started a fresh increase and surpassed $31,000 against the US Dollar. BTC could correct gains, but dips might remain well supported above $30,800.
Bitcoin is gaining pace above the $30,500 and $31,000 resistance levels.
The price is now trading above the $31,000 level and the 100 hourly simple moving average.
There is a connecting bullish trend line forming with support near $31,250 on the hourly chart of the BTC/USD pair (data feed from Kraken).
The pair could rally further if it clears the $32,200 resistance zone.
Bitcoin price remained well bid above the $30,000 pivot level. It formed a base and started a fresh increase above the $30,500 resistance zone.
The price gained pace above the $31,200 resistance zone and settled well above the 100 hourly simple moving average. Finally, there was a spike above the $32,000 level and the price traded as high as $32,186. It is now correcting gains below $32,000.
There was a move below the 23.6% Fib retracement level of the upward move from the $30,234 swing low to $32,186 high. However, there is a connecting bullish trend line forming with support near $31,250 on the hourly chart of the BTC/USD pair.
Source: BTCUSD on TradingView.com
An immediate resistance on the upside is near the $32,200 level. The next major resistance is near the $32,200 level. A clear move above the $32,200 resistance level might call another increase. In the stated case, the price could even clear the $32,500 resistance. The next major resistance sits near the $33,400 level.
If bitcoin fails to clear the $32,200 resistance zone, it could start a downside correction. An immediate support on the downside is near the $31,500 level. The first major support is near the $31,250 level and the trend line. It is close to the 50% Fib retracement level of the upward move from the $30,234 swing low to $32,186 high.
The main support is now forming near the $30,800 level. A downside break below the $30,800 support might put a lot of pressure on the bulls. In the stated case, the price may perhaps revisit the $30,000 support zone in the near term.
Technical indicators:
Hourly MACD – The MACD is now losing pace in the bullish zone.
Hourly RSI (Relative Strength Index) – The RSI for BTC/USD is now well above the 60 level.
Major Support Levels – $31,250, followed by $30,800.
Major Resistance Levels – $32,200, $32,200 and $33,400.
Tags: bitcoinbtcusdBTCUSDTxbtusd
FeedzyRead More
Weiss Crypto says Bitcoin may be approaching one of its strongest buying opportunities in years,…
Bitcoin price started a fresh decline below the $72,500 zone. BTC is consolidating and might…
Bitcoin’s recovery attempts are still being judged against a larger structure that has controlled price…
Bitcoin Magazine CME Group Goes Live With 24/7 Crypto Futures and Options, Launches Bitcoin Volatility…
Bitcoin is still trading above $60,000, but there are questions as to whether that area…
Michael Saylor's Strategy has evolved into a far more complex bitcoin-finance machine since it last…