Bitcoin started a fresh increase and surpassed $31,000 against the US Dollar. BTC could correct gains, but dips might remain well supported above $30,800.
Bitcoin is gaining pace above the $30,500 and $31,000 resistance levels.
The price is now trading above the $31,000 level and the 100 hourly simple moving average.
There is a connecting bullish trend line forming with support near $31,250 on the hourly chart of the BTC/USD pair (data feed from Kraken).
The pair could rally further if it clears the $32,200 resistance zone.
Bitcoin Price Rallies 5%
Bitcoin price remained well bid above the $30,000 pivot level. It formed a base and started a fresh increase above the $30,500 resistance zone.
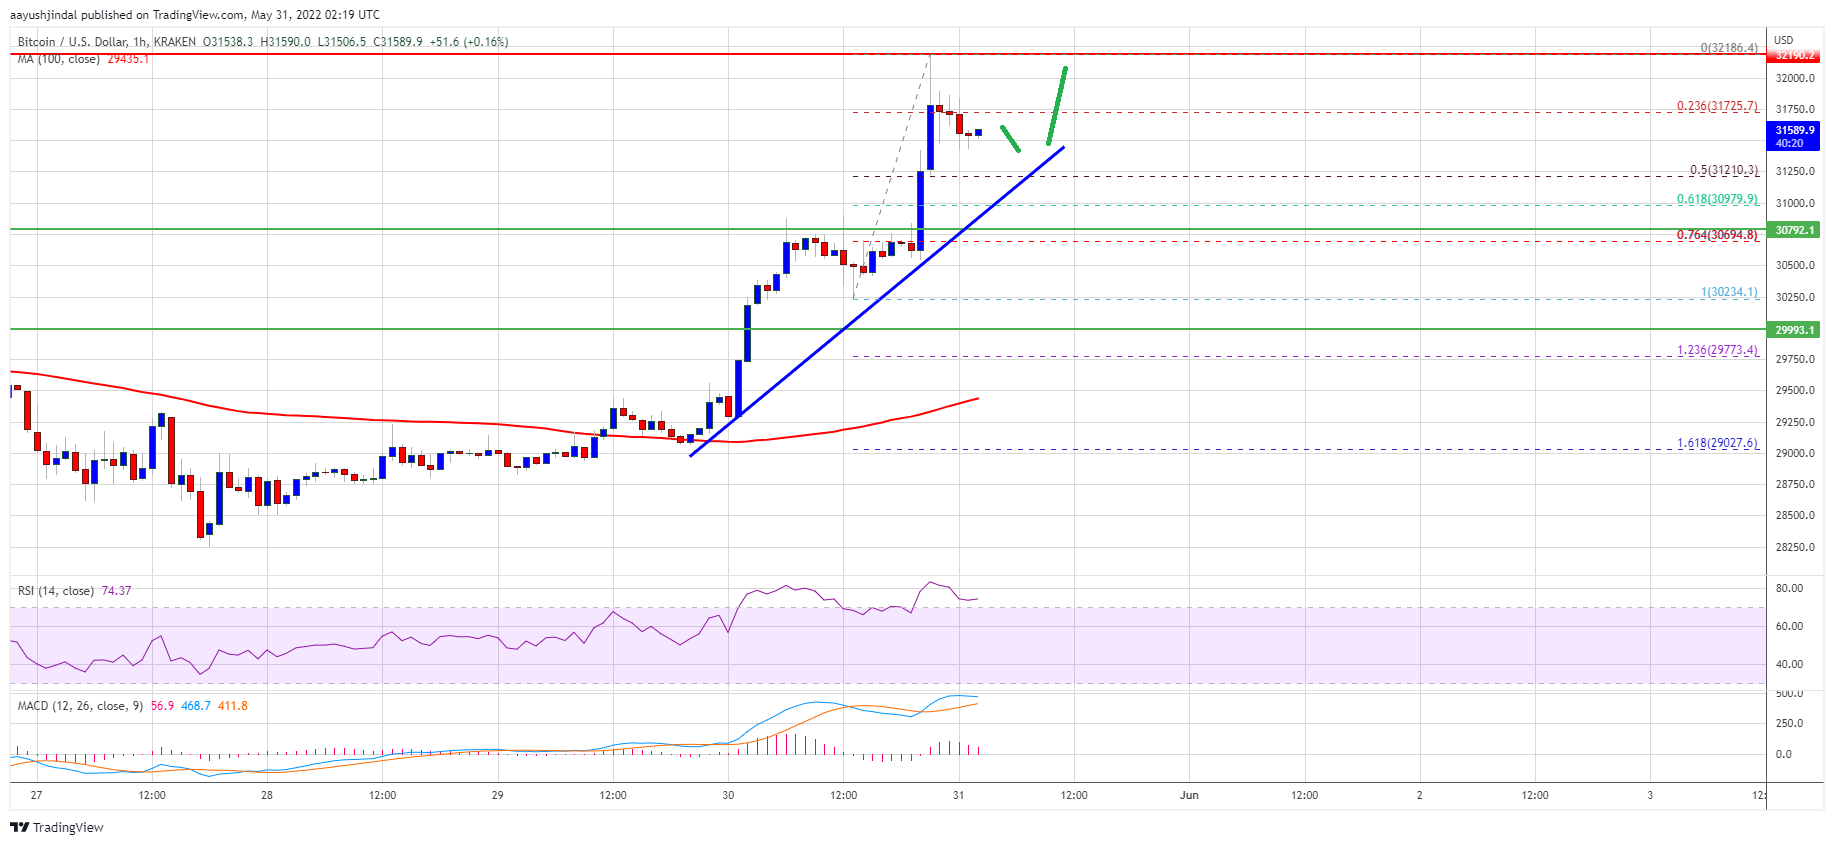
The price gained pace above the $31,200 resistance zone and settled well above the 100 hourly simple moving average. Finally, there was a spike above the $32,000 level and the price traded as high as $32,186. It is now correcting gains below $32,000.
There was a move below the 23.6% Fib retracement level of the upward move from the $30,234 swing low to $32,186 high. However, there is a connecting bullish trend line forming with support near $31,250 on the hourly chart of the BTC/USD pair.
Source: BTCUSD on TradingView.com
An immediate resistance on the upside is near the $32,200 level. The next major resistance is near the $32,200 level. A clear move above the $32,200 resistance level might call another increase. In the stated case, the price could even clear the $32,500 resistance. The next major resistance sits near the $33,400 level.
Dips Limited in BTC?
If bitcoin fails to clear the $32,200 resistance zone, it could start a downside correction. An immediate support on the downside is near the $31,500 level. The first major support is near the $31,250 level and the trend line. It is close to the 50% Fib retracement level of the upward move from the $30,234 swing low to $32,186 high.
The main support is now forming near the $30,800 level. A downside break below the $30,800 support might put a lot of pressure on the bulls. In the stated case, the price may perhaps revisit the $30,000 support zone in the near term.
Technical indicators:
Hourly MACD – The MACD is now losing pace in the bullish zone.
Hourly RSI (Relative Strength Index) – The RSI for BTC/USD is now well above the 60 level.
Major Support Levels – $31,250, followed by $30,800.
Major Resistance Levels – $32,200, $32,200 and $33,400.
Bitcoin started a fresh increase and surpassed $31,000 against the US Dollar. BTC could correct gains, but dips might remain well supported above $30,800.
Bitcoin is gaining pace above the $30,500 and $31,000 resistance levels.
The price is now trading above the $31,000 level and the 100 hourly simple moving average.
There is a connecting bullish trend line forming with support near $31,250 on the hourly chart of the BTC/USD pair (data feed from Kraken).
The pair could rally further if it clears the $32,200 resistance zone.
Bitcoin price remained well bid above the $30,000 pivot level. It formed a base and started a fresh increase above the $30,500 resistance zone.
The price gained pace above the $31,200 resistance zone and settled well above the 100 hourly simple moving average. Finally, there was a spike above the $32,000 level and the price traded as high as $32,186. It is now correcting gains below $32,000.
There was a move below the 23.6% Fib retracement level of the upward move from the $30,234 swing low to $32,186 high. However, there is a connecting bullish trend line forming with support near $31,250 on the hourly chart of the BTC/USD pair.
Source: BTCUSD on TradingView.com
An immediate resistance on the upside is near the $32,200 level. The next major resistance is near the $32,200 level. A clear move above the $32,200 resistance level might call another increase. In the stated case, the price could even clear the $32,500 resistance. The next major resistance sits near the $33,400 level.
If bitcoin fails to clear the $32,200 resistance zone, it could start a downside correction. An immediate support on the downside is near the $31,500 level. The first major support is near the $31,250 level and the trend line. It is close to the 50% Fib retracement level of the upward move from the $30,234 swing low to $32,186 high.
The main support is now forming near the $30,800 level. A downside break below the $30,800 support might put a lot of pressure on the bulls. In the stated case, the price may perhaps revisit the $30,000 support zone in the near term.
Technical indicators:
Hourly MACD – The MACD is now losing pace in the bullish zone.
Hourly RSI (Relative Strength Index) – The RSI for BTC/USD is now well above the 60 level.
Major Support Levels – $31,250, followed by $30,800.
Major Resistance Levels – $32,200, $32,200 and $33,400.
Tags: bitcoinbtcusdBTCUSDTxbtusd
FeedzyRead More
Each escalation in the Iran conflict has been larger than the last, but each bitcoin…
The Bitcoin price has not particularly impressed over the past two weeks, but it appears…
Bitcoin’s extended pullback from its all-time high has left traders in uncertainty, and many investors…
Bitcoin recently pushed into a key liquidity pocket near the $73,000 level, briefly tapping overhead…
The price of Bitcoin put in another interesting performance over the past week, as the…
Strategy’s stock is trading below the value of its own Bitcoin holdings — an unusual…