Bitcoin found support near $34,300 and started a strong recovery against the US Dollar. BTC climbed above $38,000, but it is still struggling near $40,000.
Bitcoin found support near the $34,300 and $34,500 levels.
The price is trading above $38,000 and the 100 hourly simple moving average.
There is a key bullish trend line forming with support near $37,600 on the hourly chart of the BTC/USD pair (data feed from Kraken).
The pair could rise further if there is a clear move above $39,500 and $40,000.
Bitcoin Price Gains Momentum
Bitcoin price extended decline below the $35,000 support zone. However, BTC found support near the $34,300 and $34,500 levels. A low was formed near $34,333 and the price started a strong upward move.
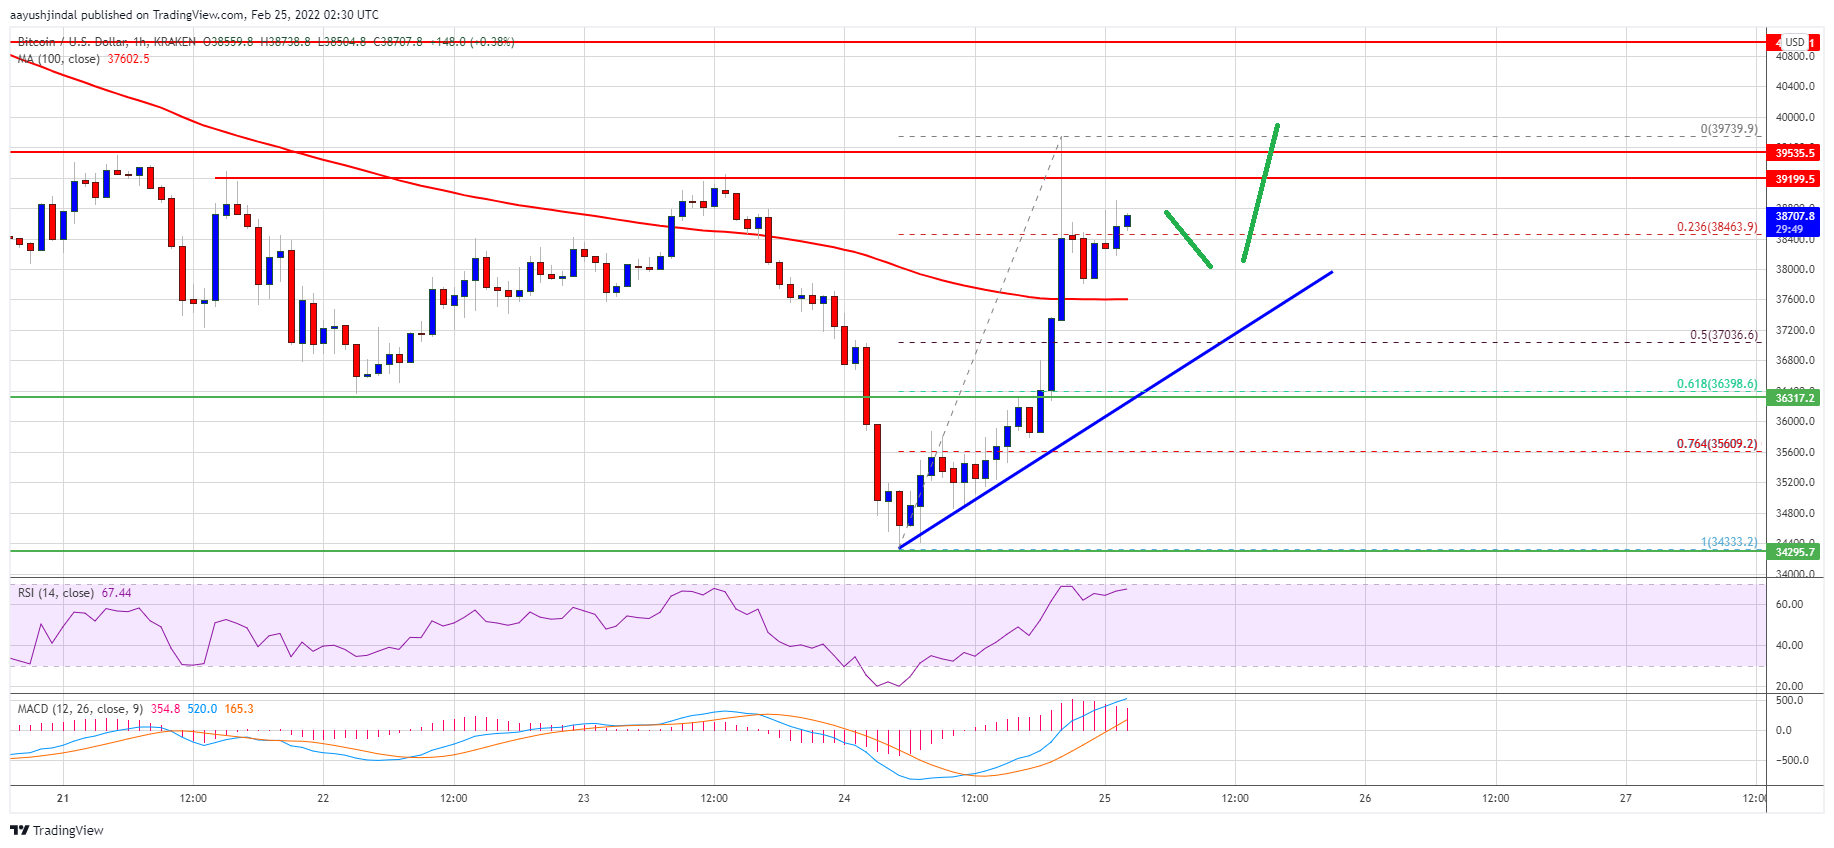
The price climbed above the $36,500 and $37,000 resistance levels. The bulls were able to push the price above the $38,000 level and the 100 hourly simple moving average. It even spiked above the $39,500 resistance level, but there was no upside continuation.
A high is formed near $39,739 and the price is now consolidating gains. It traded below the 23.6% Fib retracement level of the upward move from the $34,333 swing low to $39,739 high.
Bitcoin is now trading above $38,000 and the 100 hourly simple moving average. There is also a key bullish trend line forming with support near $37,600 on the hourly chart of the BTC/USD pair.
Source: BTCUSD on TradingView.com
On the upside, an immediate resistance is near the $39,200 level. The next key resistance is near the $39,500 level. The main resistance is still near the $40,000 level. A clear move above the $40,000 resistance could send the price further higher. In the stated case, it could even test $41,200.
Dips Limited in BTC?
If bitcoin fails to clear the $39,500 resistance zone, it could start a downside correction. An immediate support on the downside is near the $38,000 zone.
The next major support is seen near the $37,800 level and the trend line. If there is a downside break below the trend line support, the price might gain bearish momentum towards $36,000.
Technical indicators:
Hourly MACD – The MACD is now gaining pace in the bullish zone.
Hourly RSI (Relative Strength Index) – The RSI for BTC/USD is well above the 50 level.
Major Support Levels – $38,000, followed by $37,800.
Major Resistance Levels – $39,200, $39,500 and $40,000.
Bitcoin found support near $34,300 and started a strong recovery against the US Dollar. BTC climbed above $38,000, but it is still struggling near $40,000.
Bitcoin found support near the $34,300 and $34,500 levels.
The price is trading above $38,000 and the 100 hourly simple moving average.
There is a key bullish trend line forming with support near $37,600 on the hourly chart of the BTC/USD pair (data feed from Kraken).
The pair could rise further if there is a clear move above $39,500 and $40,000.
Bitcoin price extended decline below the $35,000 support zone. However, BTC found support near the $34,300 and $34,500 levels. A low was formed near $34,333 and the price started a strong upward move.
The price climbed above the $36,500 and $37,000 resistance levels. The bulls were able to push the price above the $38,000 level and the 100 hourly simple moving average. It even spiked above the $39,500 resistance level, but there was no upside continuation.
A high is formed near $39,739 and the price is now consolidating gains. It traded below the 23.6% Fib retracement level of the upward move from the $34,333 swing low to $39,739 high.
Bitcoin is now trading above $38,000 and the 100 hourly simple moving average. There is also a key bullish trend line forming with support near $37,600 on the hourly chart of the BTC/USD pair.
Source: BTCUSD on TradingView.com
On the upside, an immediate resistance is near the $39,200 level. The next key resistance is near the $39,500 level. The main resistance is still near the $40,000 level. A clear move above the $40,000 resistance could send the price further higher. In the stated case, it could even test $41,200.
If bitcoin fails to clear the $39,500 resistance zone, it could start a downside correction. An immediate support on the downside is near the $38,000 zone.
The next major support is seen near the $37,800 level and the trend line. If there is a downside break below the trend line support, the price might gain bearish momentum towards $36,000.
Technical indicators:
Hourly MACD – The MACD is now gaining pace in the bullish zone.
Hourly RSI (Relative Strength Index) – The RSI for BTC/USD is well above the 50 level.
Major Support Levels – $38,000, followed by $37,800.
Major Resistance Levels – $39,200, $39,500 and $40,000.
Tags: bitcoinbtcusdBTCUSDTxbtusd
FeedzyRead More
Bitcoin’s move back toward the $64,000 area gives bulls something to work with, but it…
Bitcoin Magazine Strategy (MSTR) Raises $467 Million in Cash, Leaves Stash of 843,775 Bitcoin Untouched…
Bitcoin Magazine Strive (ASST) Adds 18 Bitcoin, Pushing Treasury to 19,900 BTC Strive, Inc. (Nasdaq:…
The company raised the fresh cash via sales of common stock; its USD Reserve now…
ETF flows are back in the green, and that gives crypto traders a cleaner demand…
Your day-ahead look for July 13, 2026Read MoreCoinDesk: Bitcoin, Ethereum, Crypto News and Price Data[#item_full_content]