Bitcoin failed to recover above $39,500 and declined against the US Dollar. BTC remains at a risk of more losses and could even test $35,000.
Bitcoin struggled to recover above the $39,500 and $40,000 resistance levels.
The price is trading below $38,000 and the 100 hourly simple moving average.
There is a major bearish trend line forming with resistance near $38,850 on the hourly chart of the BTC/USD pair (data feed from Kraken).
The pair could extend losses below the $36,000 level in the near term.
Bitcoin Price Remains At Risk
Bitcoin price attempted an upside correction above the $38,800 resistance level. However, BTC struggled to recover above the $39,500 and $40,000 resistance levels.
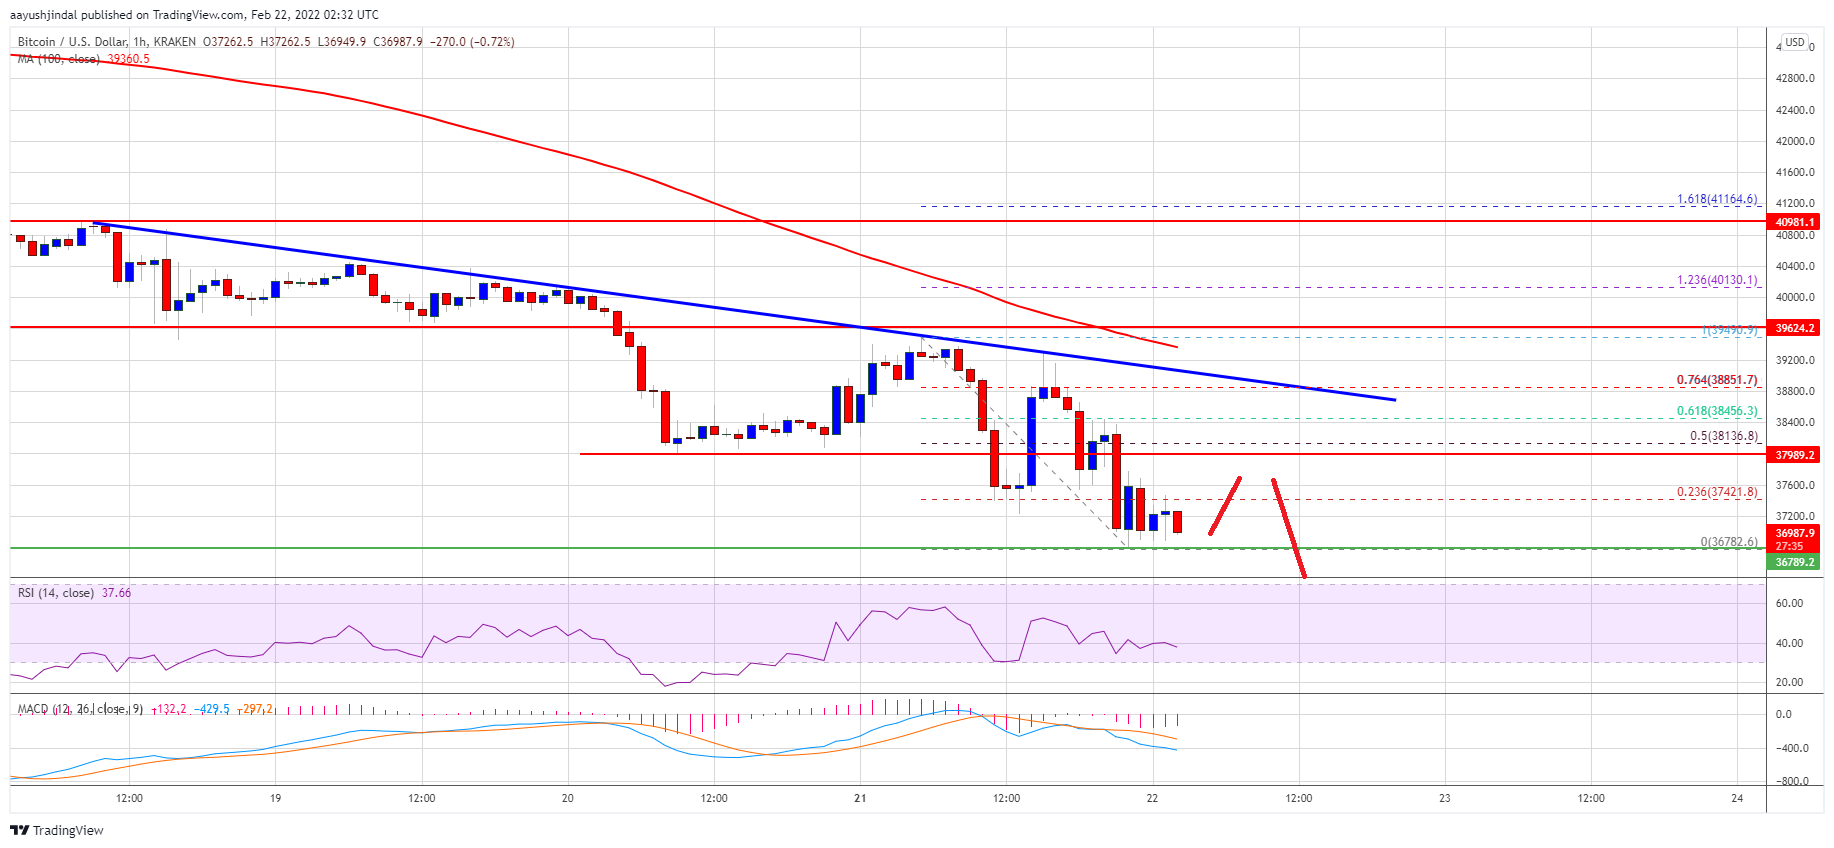
A high was formed near $39,490 and the price started a fresh decline. There was a clear move below the $38,800 and $38,000 support levels. The price traded below the $37,000 level and the 100 hourly simple moving average.
A low is formed near $36,782 and bitcoin is now consolidating losses. On the upside, an initial resistance is near the $37,420. It is near the 23.6% Fib retracement level of the recent decline from the $39,490 swing high to $36,782 low.
The next key resistance is near the $38,200 level. The 50% Fib retracement level of the recent decline from the $39,490 swing high to $36,782 low is also near the $38,200 zone. More importantly, there is a major bearish trend line forming with resistance near $38,850 on the hourly chart of the BTC/USD pair.
Source: BTCUSD on TradingView.com
A clear move above the trend line resistance could send the price to $39,400 and the 100 hourly simple moving average. To move into a positive zone, the price must settle above the $40,000 level.
More Losses in BTC?
If bitcoin fails to start a recovery wave above the $38,850 resistance zone, it could continue to move down. An immediate support on the downside is near the $36,800 zone.
The next major support is seen near the $36,500 level. If there is a downside break below the $36,500 support zone, the price might gain bearish momentum for a move to $35,000.
Technical indicators:
Hourly MACD – The MACD is now gaining pace in the bearish zone.
Hourly RSI (Relative Strength Index) – The RSI for BTC/USD is well above the 50 level.
Major Support Levels – $36,800, followed by $36,500.
Major Resistance Levels – $38,200, $38,500 and $39,500.
Bitcoin failed to recover above $39,500 and declined against the US Dollar. BTC remains at a risk of more losses and could even test $35,000.
Bitcoin struggled to recover above the $39,500 and $40,000 resistance levels.
The price is trading below $38,000 and the 100 hourly simple moving average.
There is a major bearish trend line forming with resistance near $38,850 on the hourly chart of the BTC/USD pair (data feed from Kraken).
The pair could extend losses below the $36,000 level in the near term.
Bitcoin price attempted an upside correction above the $38,800 resistance level. However, BTC struggled to recover above the $39,500 and $40,000 resistance levels.
A high was formed near $39,490 and the price started a fresh decline. There was a clear move below the $38,800 and $38,000 support levels. The price traded below the $37,000 level and the 100 hourly simple moving average.
A low is formed near $36,782 and bitcoin is now consolidating losses. On the upside, an initial resistance is near the $37,420. It is near the 23.6% Fib retracement level of the recent decline from the $39,490 swing high to $36,782 low.
The next key resistance is near the $38,200 level. The 50% Fib retracement level of the recent decline from the $39,490 swing high to $36,782 low is also near the $38,200 zone. More importantly, there is a major bearish trend line forming with resistance near $38,850 on the hourly chart of the BTC/USD pair.
Source: BTCUSD on TradingView.com
A clear move above the trend line resistance could send the price to $39,400 and the 100 hourly simple moving average. To move into a positive zone, the price must settle above the $40,000 level.
If bitcoin fails to start a recovery wave above the $38,850 resistance zone, it could continue to move down. An immediate support on the downside is near the $36,800 zone.
The next major support is seen near the $36,500 level. If there is a downside break below the $36,500 support zone, the price might gain bearish momentum for a move to $35,000.
Technical indicators:
Hourly MACD – The MACD is now gaining pace in the bearish zone.
Hourly RSI (Relative Strength Index) – The RSI for BTC/USD is well above the 50 level.
Major Support Levels – $36,800, followed by $36,500.
Major Resistance Levels – $38,200, $38,500 and $39,500.
Tags: bitcoinbtcusdBTCUSDTxbtusd
FeedzyRead More
The bridging protocol's team wants to exchange ACX tokens for equity in a new U.S.…
Brent crude surged 10% after attacks on two oil tankers in Iraqi waters, with the…
Bitcoin price failed to extend its recovery wave above the $70,500 zone. BTC is now…
Bitcoin Magazine Coinbase CPO Rejects Claims of Opposing Bitcoin Tax Relief as Jack Dorsey Demands…
The security architecture surrounding Bitcoin continues to evolve as new infrastructure emerges to support self-custody…
Bitcoin is up about 7% from the Sunday lows, even as equities and gold tread…